- Government bond yields rose in April as markets pared back expectations of interest rate cuts by central banks.
- Developed market government bond yields pushed higher, with two- and 10-year US Treasury yields rising by 42 and 77 basis points, respectively.
- Investment-grade credit spreads broadly tightened over the month.
Fixed income markets continued to speculate on the timing and magnitude of rate cuts by major central banks in April. In the US, strong inflation and labour market data led to a repricing of the US Treasury market, and the market now expects only 50 basis points (bps) of rate cuts by the US Federal Reserve (Fed) in 2024, with the first cut expected in September.
US employment data showed nonfarm payrolls rising by 303,000 in March, the biggest rise in nearly a year, while the unemployment rate fell as companies continued to expand their workforces, particularly in the leisure and hospitality sector, ahead of the busy summer season.
In commodities, oil prices declined towards the end of the month, driven by a rise in US crude inventories and uncertainty around the Fed’s monetary policy.
Inflation reports in developed market economies painted a mixed picture. In the US, headline inflation rose to 3.5% in March, while core inflation, which excludes food and energy prices, remained steady at 3.8%. In the UK, headline and core inflation fell to 3.2% and 4.2%, respectively, but remained above expectations. Additionally, the closely-watched services inflation fell to 6%, but was still higher than expected. In the euro area, headline inflation remained steady at 2.4% in March, while core inflation fell slightly to 2.7%.
The Fed, Bank of England and European Central Bank all left their key interest rates unchanged at their April meetings, at 5.5%, 5.25% and 4%, respectively. In Japan, the Bank of Japan (BoJ) left its interest rate policy unchanged, but raised the possibility of implementing measures to protect the value of the yen in the future. However, markets were disappointed by the lack of policy movement, and the yen continued to depreciate against the US dollar in the days following the meeting, with the USD/JPY exchange rate surging above 160. This led to a suspected intervention by the BoJ.
Monthly performance by market
| Global government bonds | Corporate bonds | Emerging market bonds | |||
| UK | Europe | US | HY | ||
| Bloomberg Global Aggregate Treasuries (USD Hedged) | Bloomberg Sterling Corporate Bond Index (USD Hedged) | Bloomberg Euro-Aggregate Corporates Index (USD Hedged) | Bloomberg Global Aggregate USD Corporate | Bloomberg Global High Yield Index (USD Hedged) | JP Morgan Emerging Markets Bond Index (EMBI) Global Diversified (USD Hedged) |
| -1.47% | -2.12% | -0.72% | -2.36% | -0.64% | -2.01% |
Past performance is no guarantee of future returns. The performance of an index is not an exact representation of any particular investment, as you cannot invest directly in an index.
Source: Bloomberg. For the period 31 March 2024 to 30 April 2024. Calculations are in USD. Indices used as proxies of market performance. Global government bonds: Bloomberg Global Aggregate Treasuries (USD Hedged); Sterling corporate bonds: Bloomberg Sterling Corporate Bond Index (USD Hedged); Euro corporate bonds: Bloomberg Euro-Aggregate Corporate Index (USD Hedged); USD corporate bonds: Bloomberg Global Aggregate USD Corporate Index; High-yield bonds: Bloomberg Global High Yield Index (USD Hedged); Emerging market bonds: J.P. Morgan Emerging Markets Bond Index (EMBI) Global Diversified (USD Hedged).
Government bonds
Government bond yields broadly rose in April. In the US, two-year Treasury yields rose by 42 bps, while 10-year yields rose by 77 bps. In the euro area, German two- and 10-year government bond yields rose by 19 bps and 42 bps, respectively. In the UK, two- and 10-year gilt yields rose by 33 bps and 55 bps, respectively1.
Credit markets
In credit markets, investment-grade spreads broadly tightened over the month. US and euro investment-grade bond spreads tightened by 3 bps and 2 bps, respectively, while sterling investment-grade spreads widened by 2 bps2. Emerging market (EM) investment-grade and EM high-yield spreads both tightened by 7 bps and 23 bps, respectively3. EM high-yield bonds saw the largest spread tightening over the month4.
Changes in spreads

Source: Bloomberg indices: Global Aggregate Credit Average OAS Index, Global Aggregate Supranational Index, US Aggregate Corporate Average OAS Index, Euro Aggregate Corporate Average OAS Index, Sterling Aggregate Corporate Average OAS Index, US Aggregate ABS Average OAS Index, US Aggregate CMBS Average OAS Index, Global High Yield Average OAS Index, J.P. Morgan EMBI Global Diversified IG Sovereign Spread Index, J.P. Morgan EMBI Global Diversified HY Sovereign Spread Index. Data for the period 31 March to 30 April 2024.
In Europe, Q1 earnings season is in full bloom. So far, more than half of the companies that have reported have exceeded analyst estimates. Forecasts for the quarter for STOXX 600 companies had called for revenues and earnings to decrease by 3.7% and 5.2%, respectively, compared with Q1 2023 (adjusted for the energy sector).
We maintain our view that investment-grade company fundamentals are in good shape. Corporates have deleveraged their balance sheets over the past couple of years and are better positioned in terms of their leverage/interest coverage ratios than before the pandemic. The strong credit metrics will help firms remain resilient if an economic recovery takes longer than expected.
The outlook for the technical backdrop remains positive. With the upcoming rate-cutting cycle and yields at attractive levels, we expect demand for credit to remain strong.
Emerging markets
EM credit returned -2.1% in April, as the selloff in US Treasury dragged down EM returns. After months of positive risk sentiment, a third consecutive sticky inflation reading in the US forced the market to reconsider its expectations for near-term rate cuts by the Fed. EM spreads were resilient, absorbing some of the move higher in Treasury yields, mitigating larger losses and outperforming other risk assets.
Despite the risk-off sentiment in markets, EM high-yield (-1.4%) outperformed EM investment-grade (-2.8%) in April, owing to their different sensitivities to the selloff in US Treasuries5. Additionally, select high-yield sovereign issuers continued to benefit from fundamental improvements, including Ecuador (+4.4%), where officials were successful in securing a $4bn economic funding package from the International Monetary Fund.
EM spreads remained resilient across investment-grade and high-yield in April
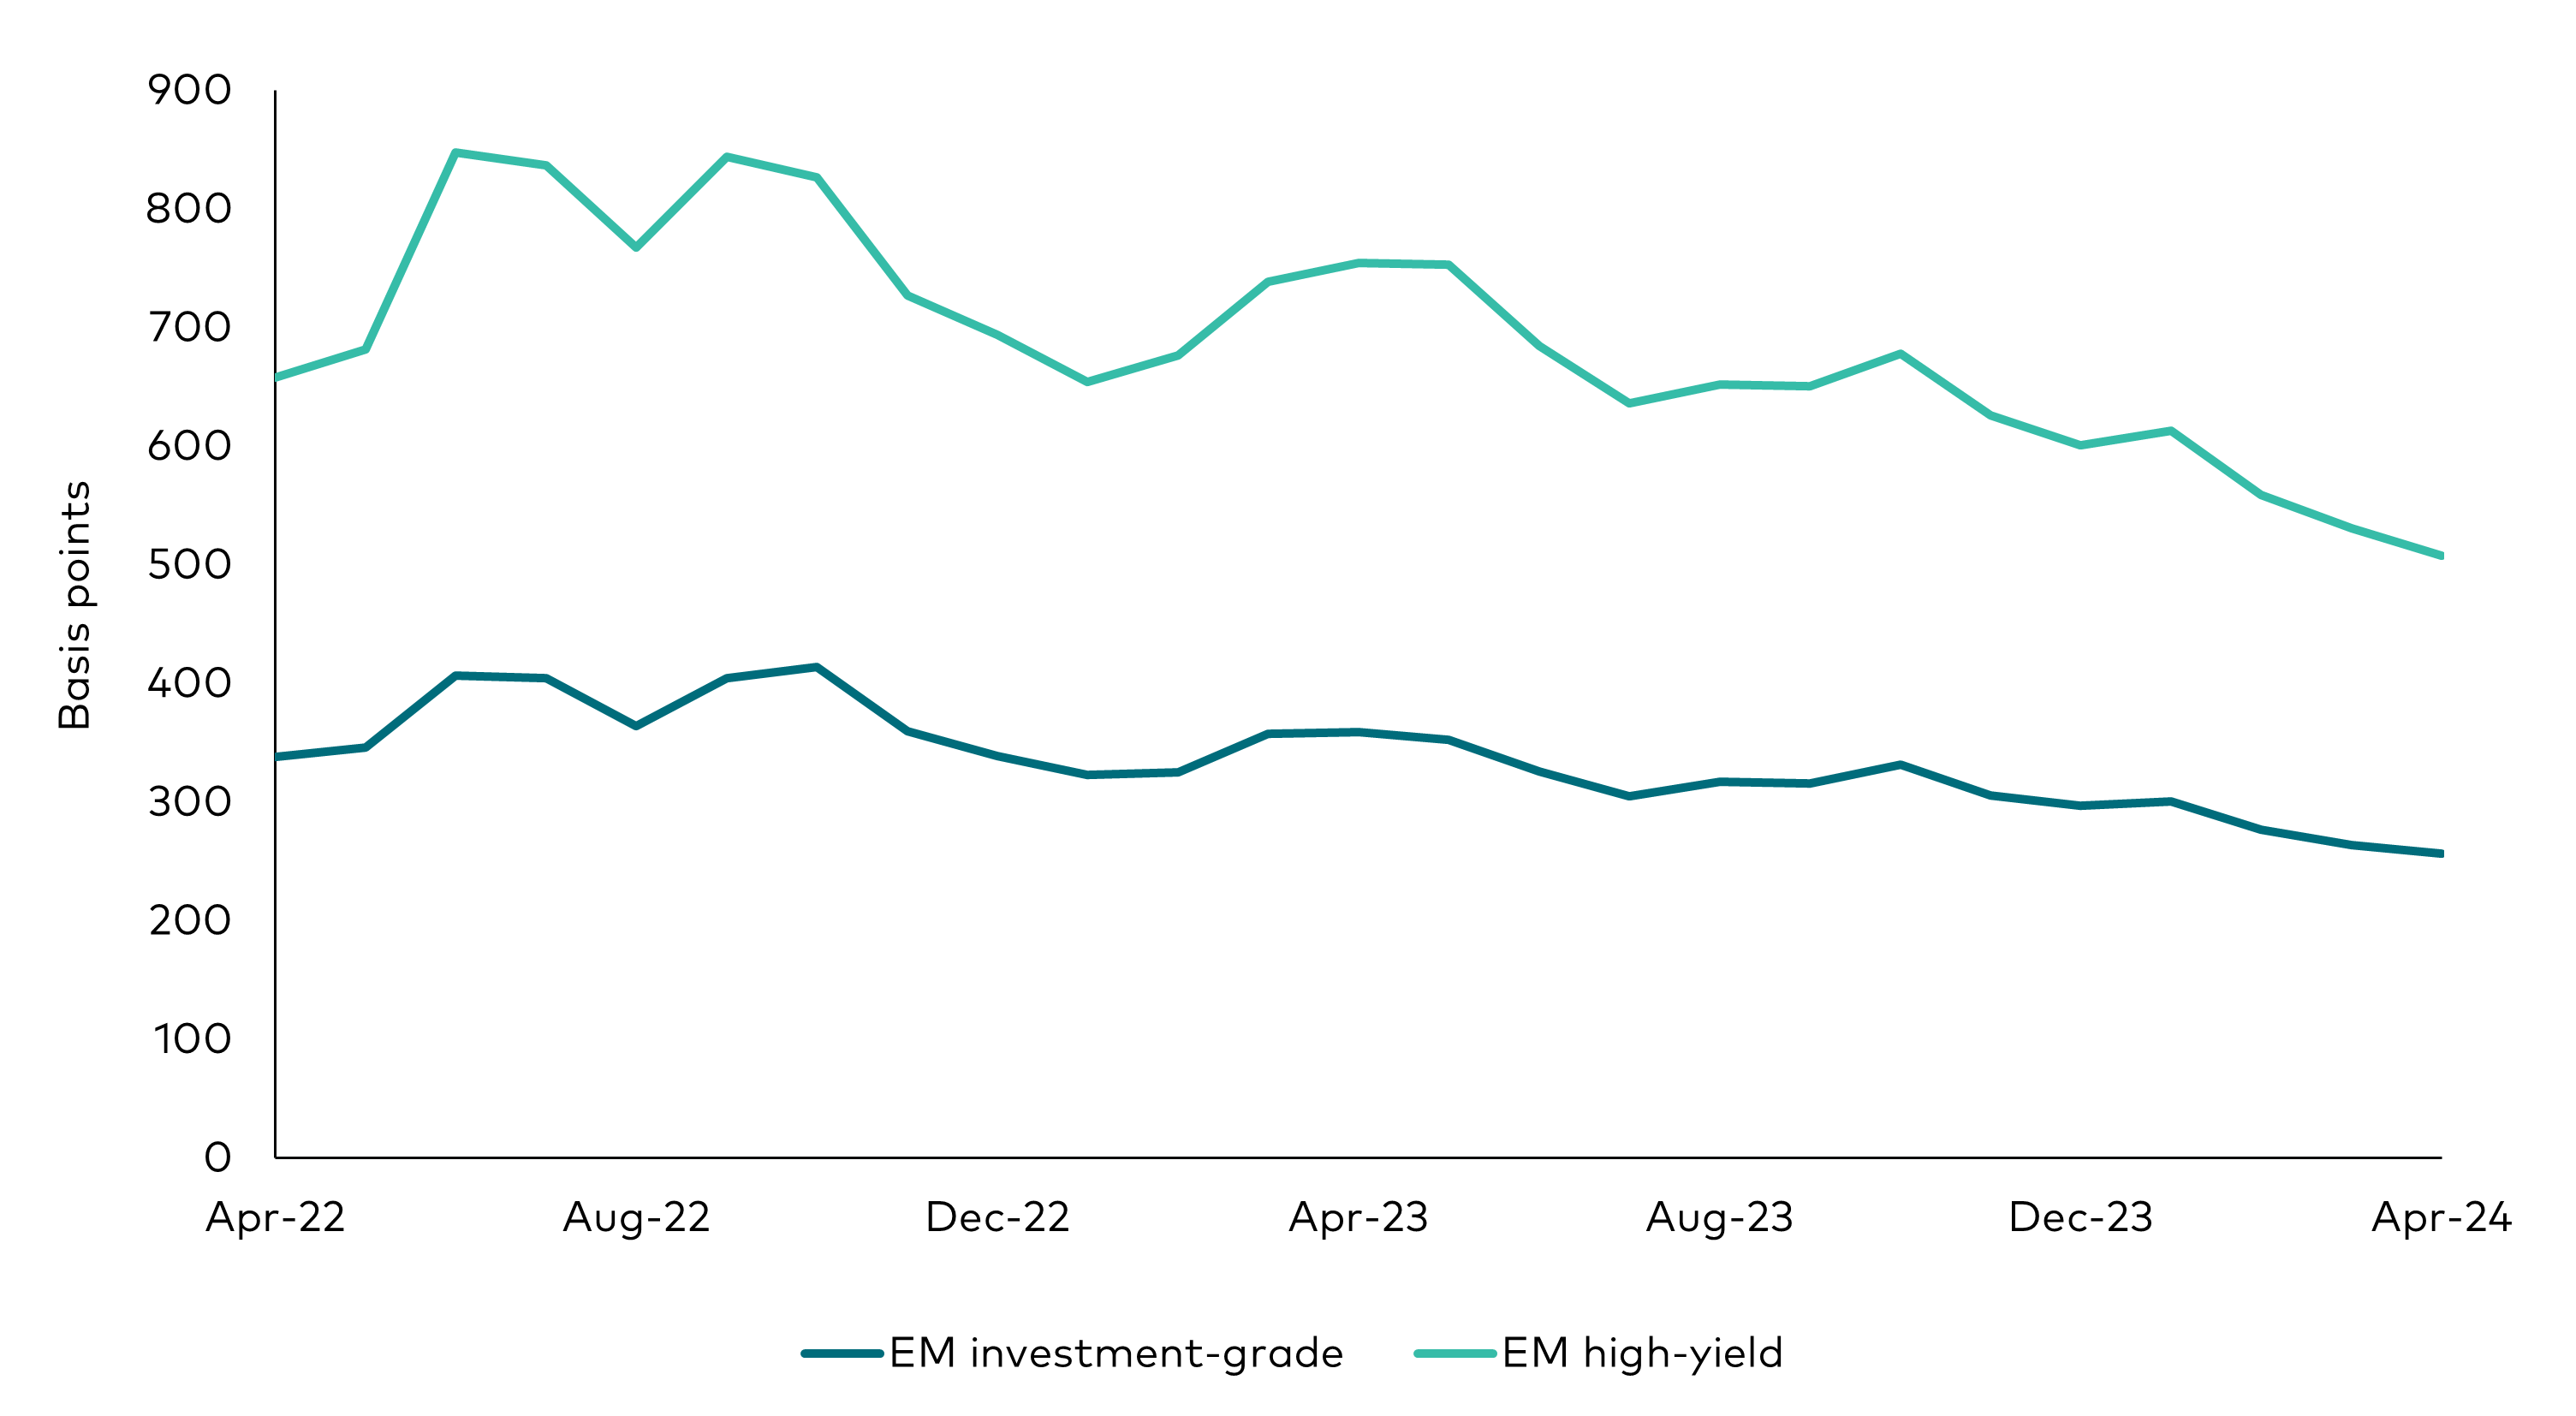
Source: Bloomberg. Data period is 24 months to 30 April 2024. ‘EM investment grade’ represented Bloomberg EM USD Aggregate Average OAS Index; ‘EM high-yield’ represented by Bloomberg Emerging Markets High Yield Average OAS Index.
Outlook
Fixed income yields remain attractive, in our view. Historically, yields at these levels have typically been followed by strong returns over the next six to 12 months.
Overall, the soft-landing narrative has continued in markets, primarily owing to the resilient growth of the US economy. Meanwhile, softer growth data has continued to be seen in Europe and the UK. Within investment-grade credit, we’re seeing European issuers mean-revert and begin to outperform US investment-grade, and we continue to see more value in European investment-grade bonds.
In high-yield corporates, we are seeing a pick-up in rising-star activity this year compared to fallen angels, as the better-than-expected macroeconomic environment proves favourable for issuers. The technical backdrop is improving, driven by a lack of supply and the upgrade of Ford Motor Company, once the largest high-yield issuer in the market, to investment-grade status late last year. A recessionary scenario would see lower-quality high-yield issuers become more vulnerable, although with yields at current levels, they would likely offset some of the potential spread widening. From a valuations perspective, we view CCC-rated issuers to be more attractive, although these names tend to be riskier given where we are in the economic cycle.
Overall, we remain constructive on EM fixed income, where valuations are tight and risks around US monetary policy remain. However, fundamentals are strong and yields are attractive, which we believe should support the asset class going forward.
1 Source: Bloomberg and Vanguard.
2 Source: Bloomberg Global Aggregate Credit Index, 31 March to 30 April 2024.
3 Source: J.P. Morgan EMBI Global Diversified Index, 31 March to 30 April 2024.
4 Source: J.P. Morgan EMBI Global Diversified Index, 31 March to 30 April 2024.
5 Source: Vanguard and J.P. Morgan. Based on the J.P. Morgan Emerging Market Bond Index (EMBI) Global Diversified relative to US Treasuries. Monthly change in spread is for the period 31 March 2024 to 30 April 2024.

Investment risk information
The value of investments, and the income from them, may fall or rise and investors may get back less than they invested.
Past performance is not a reliable indicator of future results.
Some funds invest in emerging markets which can be more volatile than more established markets. As a result the value of your investment may rise or fall.
Funds investing in fixed interest securities carry the risk of default on repayment and erosion of the capital value of your investment and the level of income may fluctuate. Movements in interest rates are likely to affect the capital value of fixed interest securities. Corporate bonds may provide higher yields but as such may carry greater credit risk increasing the risk of default on repayment and erosion of the capital value of your investment. The level of income may fluctuate and movements in interest rates are likely to affect the capital value of bonds.
Important information
For professional investors only (as defined under the MiFID II Directive) investing for their own account (including management companies (fund of funds) and professional clients investing on behalf of their discretionary clients). In Switzerland for professional investors only. Not to be distributed to the public.
The information contained herein is not to be regarded as an offer to buy or sell or the solicitation of any offer to buy or sell securities in any jurisdiction where such an offer or solicitation is against the law, or to anyone to whom it is unlawful to make such an offer or solicitation, or if the person making the offer or solicitation is not qualified to do so. The information does not constitute legal, tax, or investment advice. You must not, therefore, rely on it when making any investment decisions.
The information contained herein is for educational purposes only and is not a recommendation or solicitation to buy or sell investments.
BLOOMBERG® is a trademark and service mark of Bloomberg Finance L.P. Bloomberg Finance L.P. and its affiliates, including Bloomberg Index Services Limited ("BISL") (collectively, "Bloomberg"), or Bloomberg's licensors own all proprietary rights in the Bloomberg Indices.
The products are not sponsored, endorsed, issued, sold or promoted by “Bloomberg.” Bloomberg makes no representation or warranty, express or implied, to the owners or purchasers of the products or any member of the public regarding the advisability of investing in securities generally or in the products particularly or the ability of the Bloomberg Indices to track general bond market performance. Bloomberg shall not pass on the legality or suitability of the products with respect to any person or entity. Bloomberg’s only relationship to Vanguard and the products are the licensing of the Bloomberg Indices which are determined, composed and calculated by BISL without regard to Vanguard or the products or any owners or purchasers of the products. Bloomberg has no obligation to take the needs of the products or the owners of the products into consideration in determining, composing or calculating the Bloomberg Indices. Bloomberg shall not be responsible for and has not participated in the determination of the timing of, prices at, or quantities of the products to be issued. Bloomberg shall not have any obligation or liability in connection with the administration, marketing or trading of the products.
Information has been obtained from sources believed to be reliable but J.P. Morgan does not warrant its completeness or accuracy. The Index referenced herein is used with permission. The Index may not be copied, used, or distributed without J.P. Morgan’s prior written approval. Copyright 2016, J.P. Morgan Chase & Co. All rights reserved.
Issued in EEA by Vanguard Group (Ireland) Limited which is regulated in Ireland by the Central Bank of Ireland.
Issued in Switzerland by Vanguard Investments Switzerland GmbH.
Issued by Vanguard Asset Management, Limited which is authorised and regulated in the UK by the Financial Conduct Authority.
© 2024 Vanguard Group (Ireland) Limited. All rights reserved.
© 2024 Vanguard Investments Switzerland GmbH. All rights reserved.
© 2024 Vanguard Asset Management, Limited. All rights reserved.