Table of contents
Key takeaways
Performance summary: The divergence between a risk-off theme in the US and stronger growth in Europe continued to drive fixed income markets in the first quarter of 2025. Higher-quality bonds outperformed as US Treasury yields broadly declined and credit spreads widened. Positive bond returns helped cushion the volatility in US equities.
The big picture: The implementation of higher-than-expected tariff rates by the US administration will have substantial economic impact if maintained. Consequently, we have revised our US growth and labour market forecasts downward and increased our inflation outlook. Meanwhile, in Europe, the announcement of a €1 trillion fiscal spending package by Germany has led yields higher.
Our approach: Before the tariff announcements, we trimmed credit risk and moved up in quality. We remain optimistic on interest rates, favouring intermediate maturities as a hedge against our credit exposure. Credit valuations have improved, but not sufficiently to offset the increased uncertainty. We are overweight sectors that provide value and are more resilient to growth and policy risks.
Uncertain waters
There is a tidal shift ongoing in global fixed income markets. On 2 April, the US administration announced a broad new round of tariffs against virtually all US trading partners, greatly exceeding market expectations, before announcing a 90-day pause for many on 9 April. Uncertainty remains about where negotiations will lead, which tariffs will ultimately be implemented and how long they will last. These and other questions, such as the burgeoning levels of US federal debt, are complex, structural issues that will not be resolved quickly or easily.
The economic implications are far reaching, leading us to reassess our 2025 outlook. We believe a stagflationary scenario in the US will dampen growth and hold inflation higher in the coming months.
The rising risk of a US recession keeps us optimistic on interest rates and defensive on credit for now. We are navigating increasingly uncertain waters, where the global economic tidal transition has taken on a more unsettled tone.
In recent weeks, US fixed income has seen credit spreads widen to their highest levels since the onset of the Covid-19 pandemic in March 2020, and before that, the Global Financial Crisis. US Treasury rates have been volatile, sharply declining at the end of March due to recession fears, which triggered a flight to quality. They then retraced, especially at the long end of the yield curve, where technical factors exacerbated price movements.
From risks to realities
We expect the heightened market volatility to continue. The economic and policy focus has shifted from assessing potential risks to managing realities. Soft sentiment indicators will soon give way to hard results on inflation, trade balances, employment, wages and earnings. In the meantime, businesses will reassess their costs and plans, as governments weigh their options.
Monetary policy is at the centre of attention. We anticipate that the US Federal Reserve (Fed) will be reluctant to reduce rates until they have greater clarity around the near- and medium-term impacts from higher tariffs. If the labour market weakens materially and recession concerns rise, we think the Fed can and will support the US economy as much as is needed, provided long-term inflation expectations are stable.
In such an environment, investors will need the durability that comes through diversification. We believe bonds remain well-positioned to offer attractive income and higher returns if downside risks increase. We have put our global capabilities to use in identifying opportunities, and we think investors will find that fixed income diversification will help their portfolios retain buoyancy in these swirling seas.
Fixed income sector returns and yields
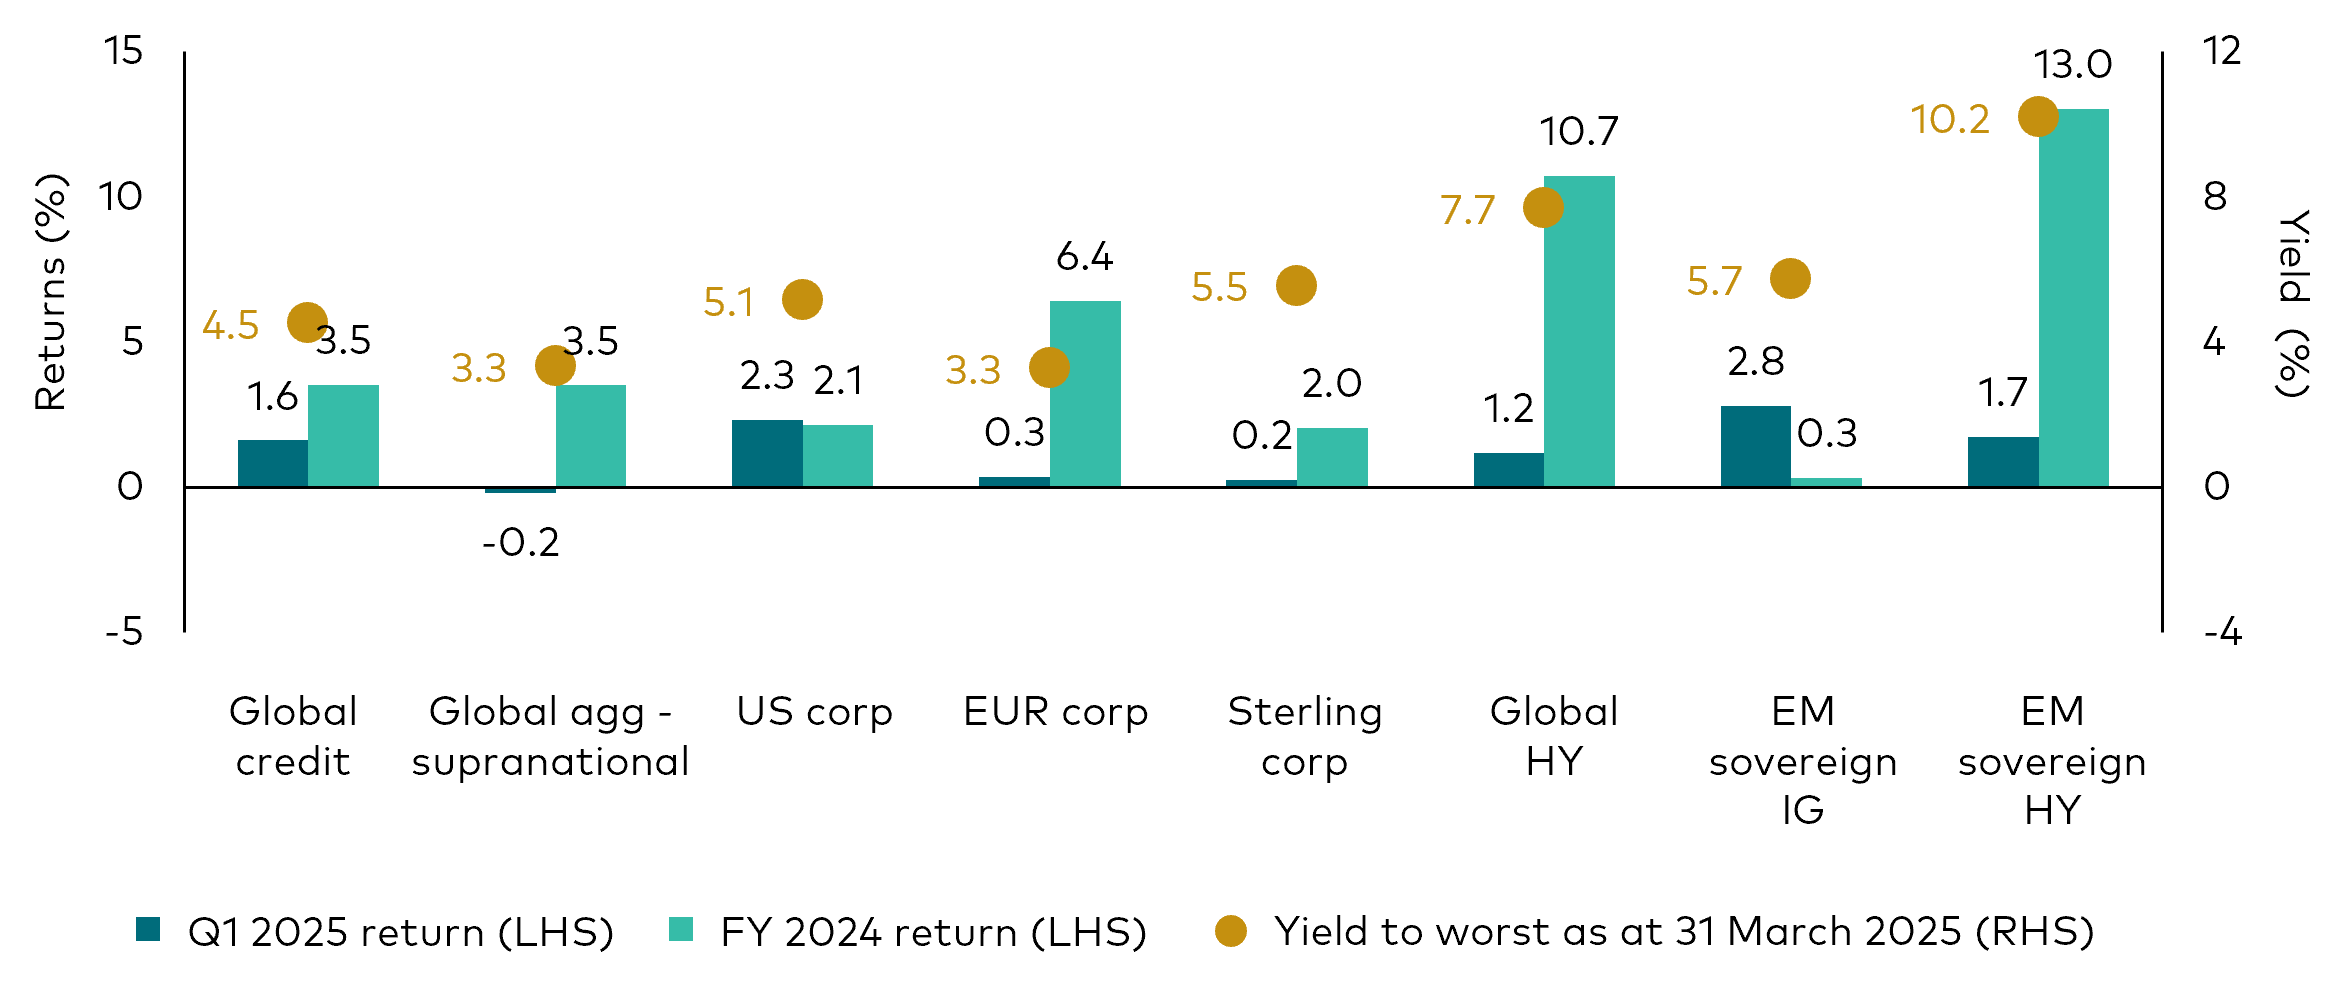
Past performance is no guarantee of future returns. The performance of an index is not an exact representation of any particular investment, as you cannot invest directly in an index.
Sources: Bloomberg indices and the J.P. Morgan EMBI Global Diversified Index. Q1 2025 return data from 31 December 2024 to 31 March 2025. FY 2024 return data from 1 January 2024 to 31 December 2024. Performance is provided on a total return basis, in the base currency of the index, or for global indices, USD hedged.
US economy and policy
While US economic activity remains firm, questions remain as to whether recent negative signs in soft data points will flow through to hard data via declines in retail sales, employment and growth over the coming months.
In recent years, the correlation between soft and hard data has been weak. However, given the significant magnitude of the recent tariff announcements, not to mention fiscal cost cutting, we anticipate broader economic weakness in the months ahead. Persistent uncertainty will act as an additional tax on the economy, further restraining corporate and household spending.
US Policy Uncertainty Index spikes to record levels after US tariffs announced
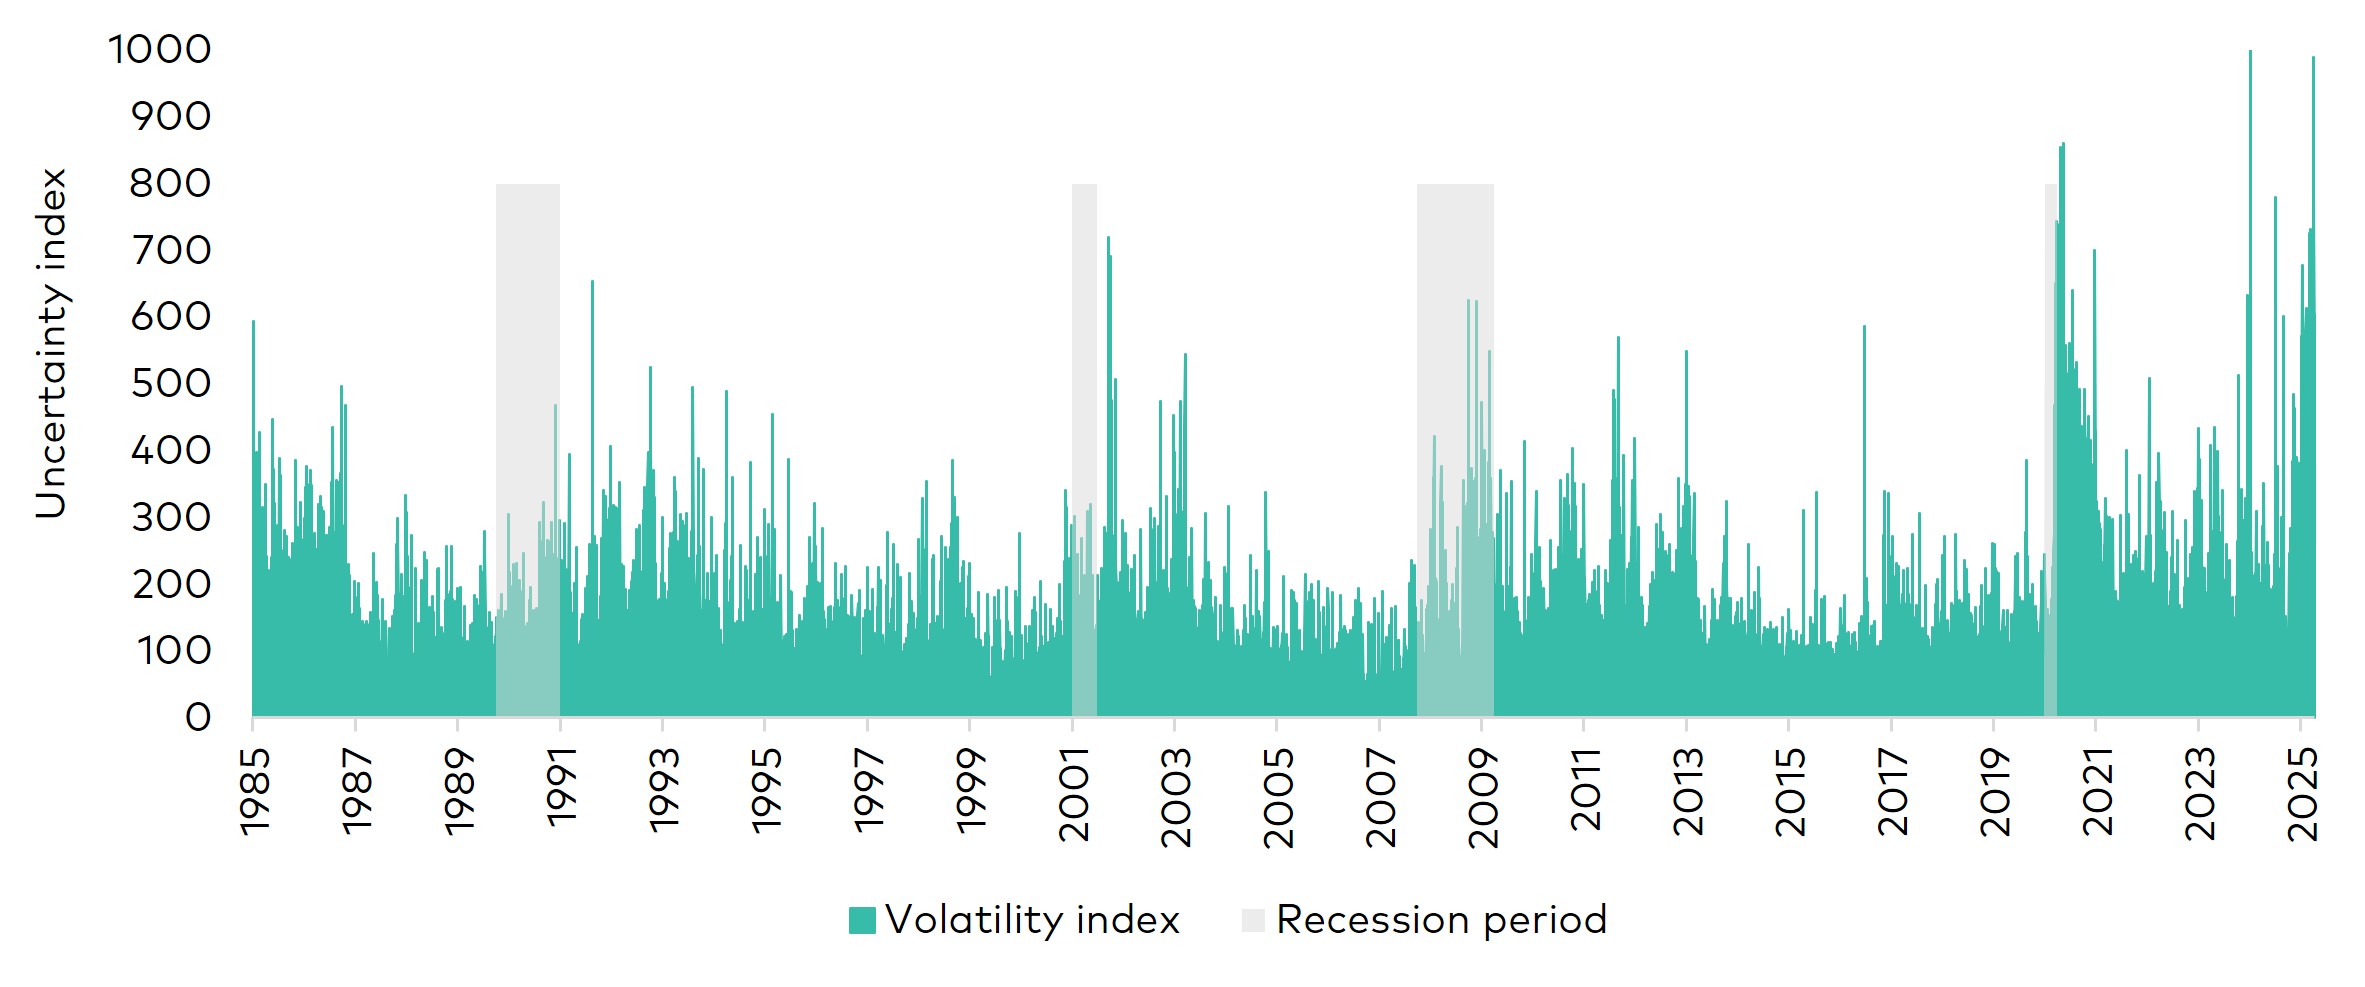
Note: The daily news-based Economic Policy Uncertainty Index is based on newspaper archives from Access World New's NewsBank service.
Source: Bloomberg. Data period from 2 January 1985 to 9 April 2025. Volatility represented by US Economic Policy Uncertainty Index.
An evolving outlook
At the start of 2025, our central case scenario called for continued strong growth, with inflation in the mid-2% range. We’ve now updated our outlook in response to tariff policy developments and added friction from higher levels of business and household uncertainty. A stagflationary scenario has now become our base case forecast.
Our revised outlook for the US accounts for tariff levels to settle above 15%, which represents a substantial increase in the aggregate rate compared with 2024. Even with the pause in reciprocal tariffs, we maintain the following forecasts:
- 2025 US GDP growth below 1%.
- Year-end 2025 US core inflation1 increasing to nearly 4%.
- US unemployment rate rising to around 5%.
Higher inflation, we believe, will create a challenging environment for the Fed. We believe the central bank is likely to keep rates on hold in the near term, but could lower its year-end 2025 target for the federal funds rate to a range of 3.25%–4.00%, as it seeks to support a slowing economy.
While the probability of a US recession has increased, it is not our base case. However, if that were to occur, we expect the Fed would meaningfully cut interest rates to support the economy.
Rates
US
Yields on 10-year US Treasuries moved as high as 4.80% at the start of 2025, as markets reflected optimism around a range of expected pro-growth policies. By mid-January, market expectations were pricing in 1.5 interest rate cuts by the Fed for 2025. However, over the remainder of the first quarter, rising growth concerns resulting from tariffs and fiscal cost-cutting pulled yields lower; with markets pricing in three cuts (0.75%) of Fed rate cuts in 2025.
Since the start of the second quarter, US Treasury yields have been volatile amid heightened policy uncertainty. The net result has been a steeper yield curve, with the difference between 10-year and 2-year US Treasury yields increasing towards 50 basis points (bps). Rising growth risks have kept front-end yields anchored while longer-end yields have increased, driven by short-term technical pressures and term-premium concerns.
US yield curve moves higher after tariff announcements
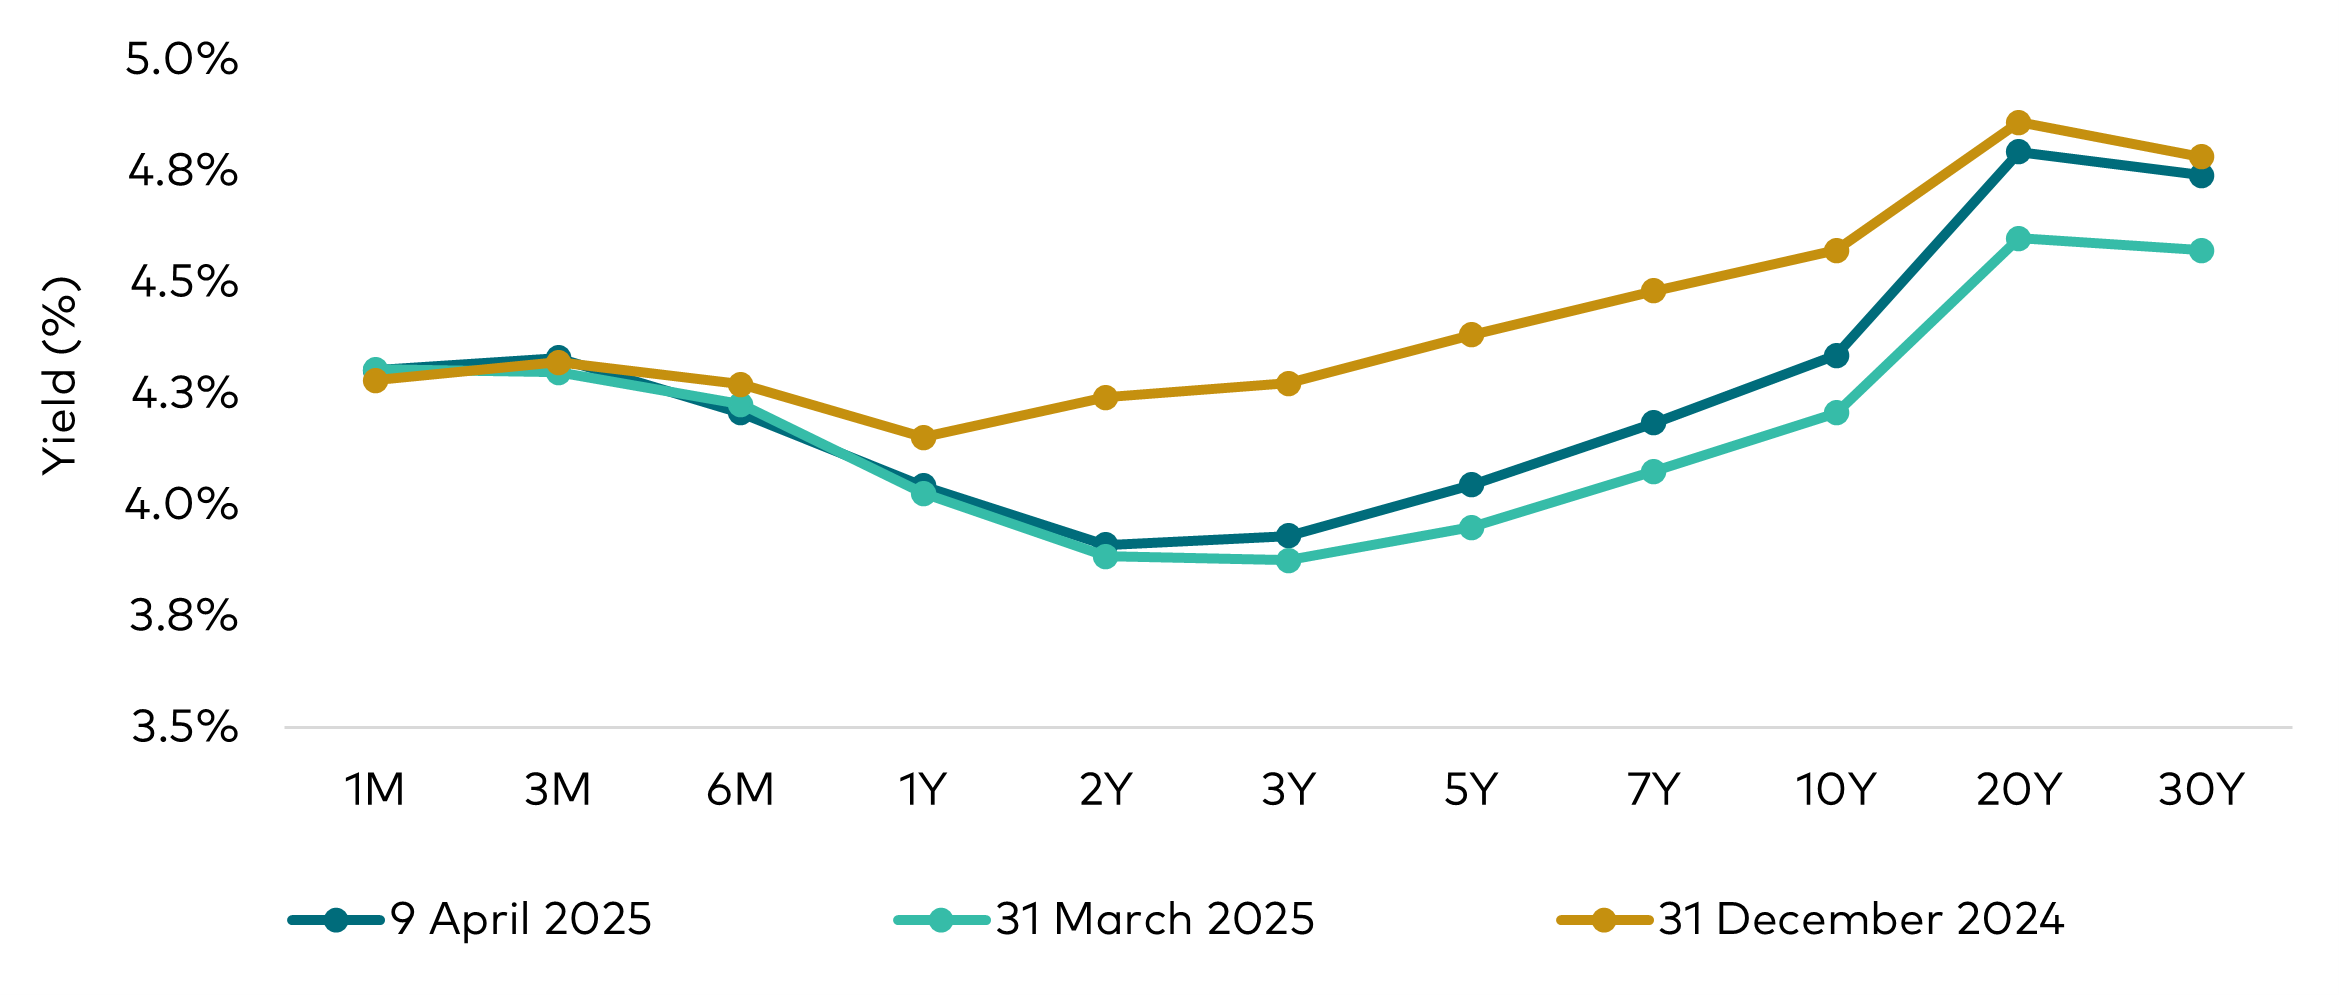
Source: Vanguard and Bloomberg, as at 9 April 2025.
Our updated outlook reinforces our confidence that US rates will trend lower. We favour intermediate-duration bonds, as the short end of the yield curve is more susceptible to monetary policy uncertainty, and the long end faces risks from technical factors, inflation and fiscal spending concerns.
We are closely monitoring factors that could push rates higher. For example, continued volatility and uncertainty may lead to a higher term premium, and growing concerns about US fiscal deficits could also play a role. However, we believe slowing growth concerns and easier monetary policy will prove to be the dominant drivers of US Treasury yields in the months ahead.
Despite the breakdown in correlations early in the second quarter, we expect US Treasuries to remain effective hedges for risk assets, if economic momentum shows credible signs of slowing. Short- and intermediate-maturity US Treasury yields could fall substantially if the odds of a recession rise, providing diversification for credit.
Europe
European bonds are presenting more opportunities as the US economic exceptionalism narrative fades - not only because of the rising risk of a US recession, but because other regions are stepping up. Changes in fiscal spending and monetary policies, particularly in Europe, are boosting growth expectations and injecting new optimism into certain local markets.
Europe’s fiscal renaissance?
For years, growth in Europe has lagged that of other developed economies, primarily due to lower spending in the private sectors of the economy. However, we believe the region has reached a turning point.
Germany’s fiscal expansion: Germany, Europe’s economic powerhouse, approved a new €1 trillion infrastructure and defense spending package after incoming chancellor Friedrich Merz declared the country must do “whatever it takes” to bolster its defense resources and support its flagging economy. The increased investment, along with the relaxation of Germany’s "debt brake" rule on defense spending, is expected to transform economic activity across Europe. The announcement triggered a sharp sell-off in 10-year German bunds, on fears that the increased spending would lead to higher future borrowing costs for the German government over the longer term. We took advantage of the situation by implementing a short position in German bunds with the expectation that yields would rise.
Germany’s fiscal easing could have a significant impact on euro area growth, inflation and monetary policy
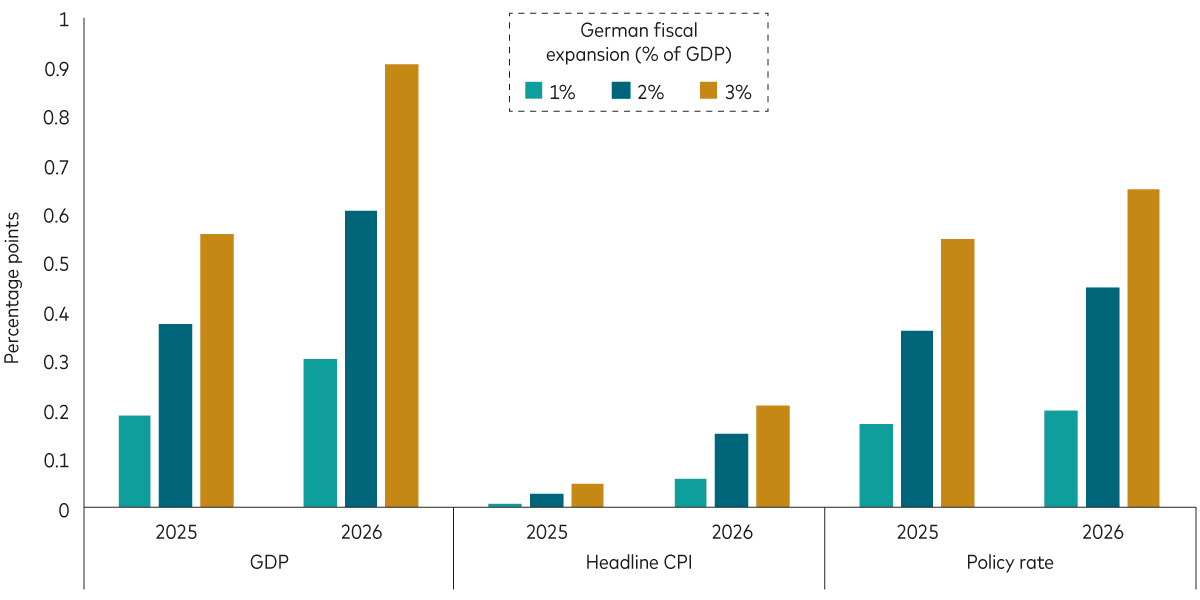
Note: The chart shows the modelled impact on euro area macroeconomic fundamentals under three different German fiscal expansion scenarios that include the fiscal deficit widening by 1% of GDP, 2% of GDP and 3% of GDP. The chart shows the deviation from baseline in each scenario and is modelled using the Oxford Economics Model. The model assumes a fiscal multiplier of one. GDP refers to the estimated cumulative impact on the level of euro area GDP by year-end 2025 and 2026. Headline consumer price index (CPI) refers to the average annual headline CPI rates. Policy rate refers to the ECB deposit facility rate by year-end. Our baseline assumption assumes a 1.5% of GDP expansion.
Source: Vanguard calculations, based on data from Bloomberg and Oxford Economics.
Squeeze play: German/US yield compression created active opportunities
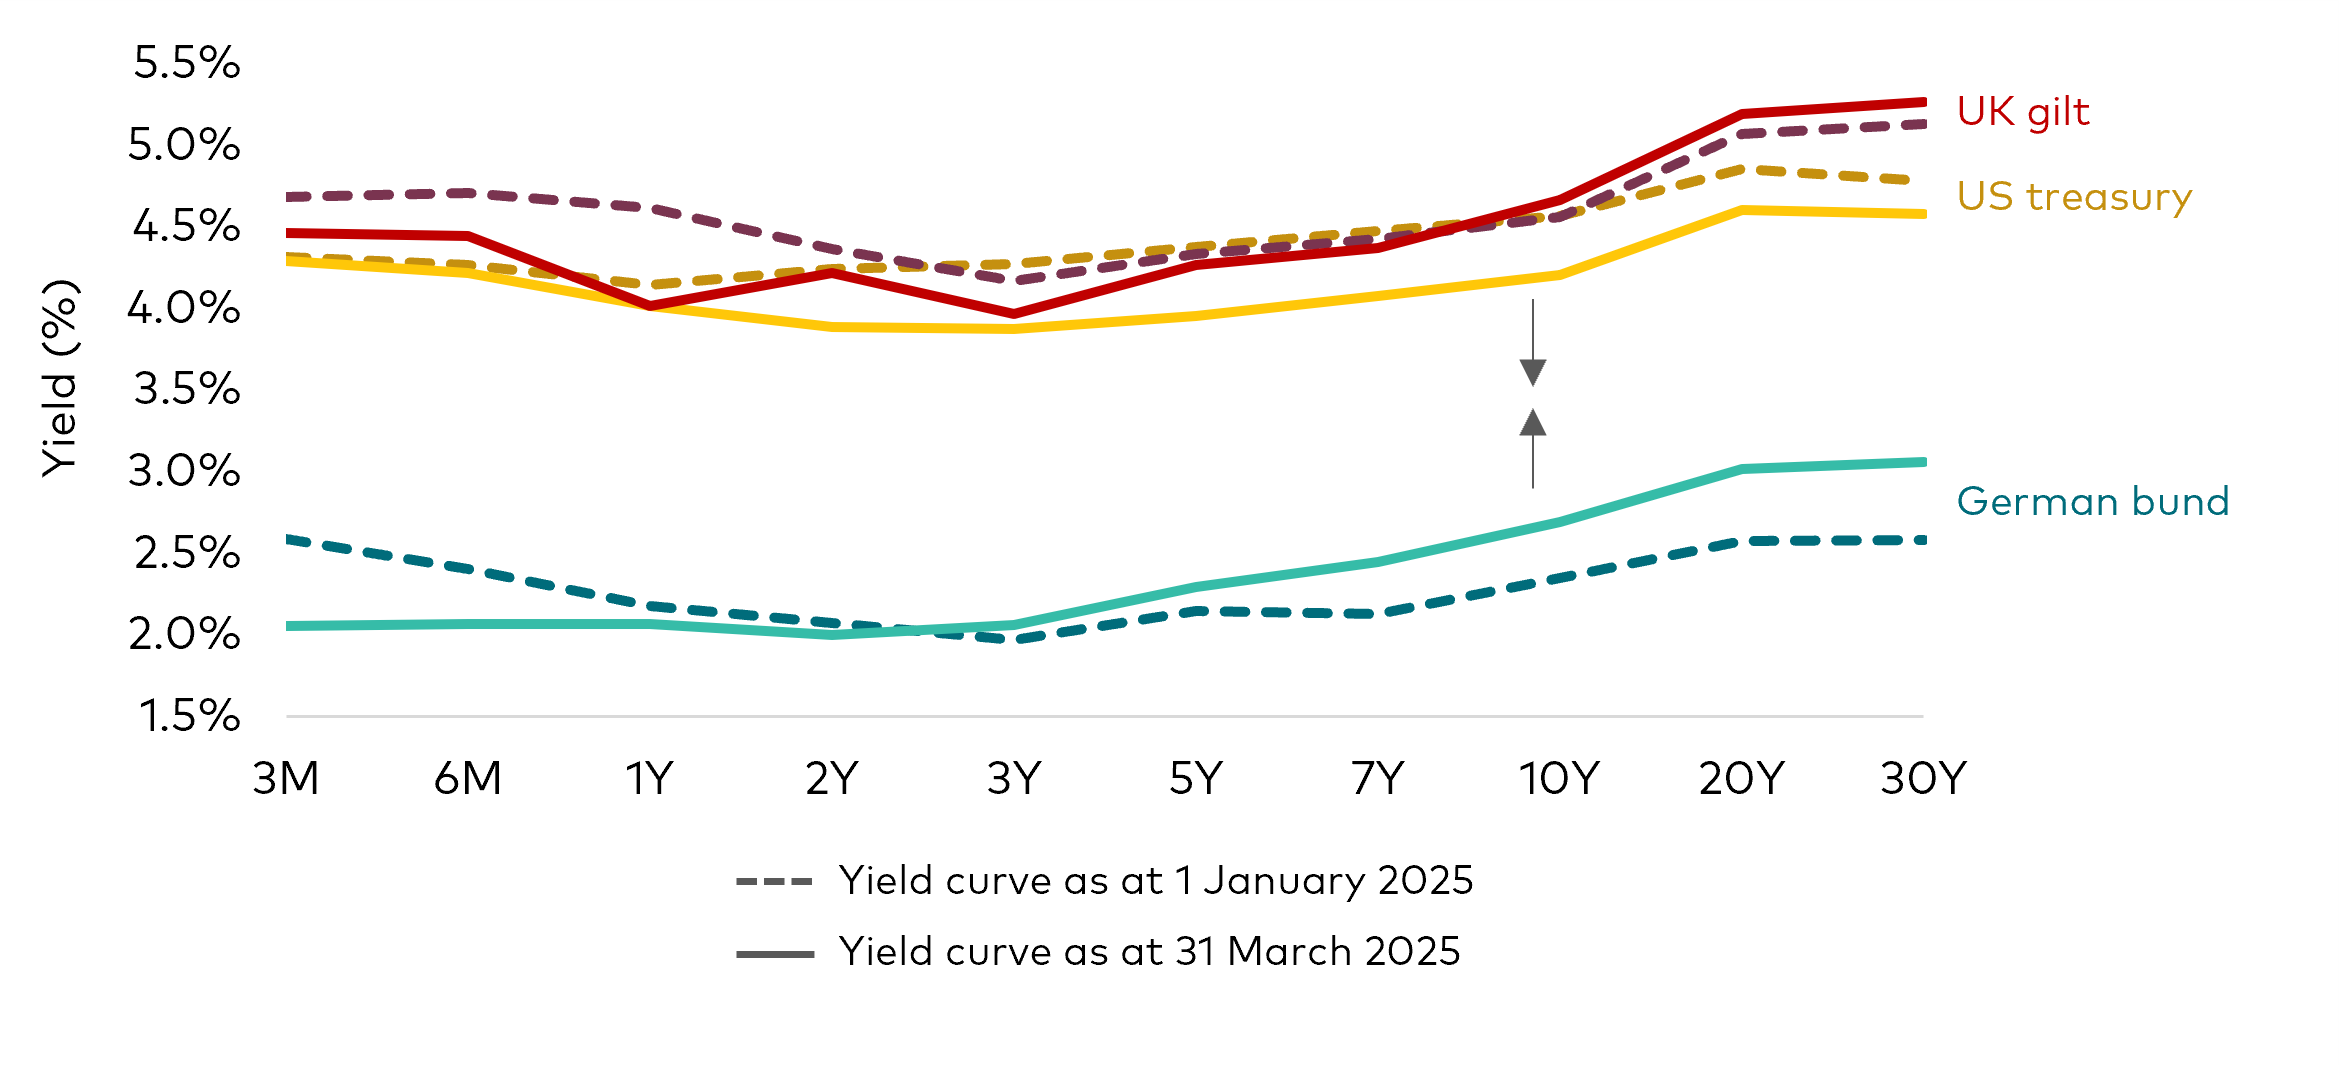
Source: Vanguard and FactSet, as at 1 January 2025 and 31 March 2025.
- Economic impact: The German fiscal expansion is expected to boost internal production and revitalise Germany’s industrial complex, which has been in decline due to increased competition from China and lack of investment that has inhibited innovation and productivity. The increased spending could add nearly one percentage point to Germany’s GDP, reversing a two-year economic contraction.
- The ECB's role: The European Central Bank (ECB) has supported the shift by cutting interest rates this year, maintaining a steady pace of 25 bps cuts - including one in March This has reduced financing costs, making credit more accessible and fostering a more cohesive European economy with stronger growth prospects.
An entry point in German bunds
- Germany’s fiscal spending announcement led to a sell-off in German bunds, pushing yields higher (with the 10-year yield reaching 2.90%), as investors anticipated a significant increase in bond issuance and a repricing of the terminal rate higher. We would view a 3% yield on the 10-year bund as a compelling buying opportunity. Market dynamics suggest there are willing buyers, indicating a stable and attractive investment environment.
- European yields are now at appealing levels from the perspective of Asian and US investors, offering a positive pickup even after hedging.
Positive outlook for Europe’s periphery economies
Not all of the euro area has been beset by disappointing growth; many of the region’s periphery economies have seen promising rebounds in the post-Covid 19 period. We’ve been overweight in countries like Spain and Greece for over a year - and the strategy has paid off. These economies have outperformed expectations, demonstrating resilience and further growth potential.
- Debt profiles: With Germany and France leading the way in new fiscal spending, the positive economic momentum is expected to also improve the debt profiles of Europe’s weaker countries. We anticipate continued contraction in sovereign spreads, indicating improved creditworthiness and reduced risk.
- Market support: The European Union’s requirement for solidarity among member states further bolsters weaker credits, with increased market support and continued spread contraction.
- Performance: Sovereign bonds in periphery countries have seen spreads decline by 100 bps, generating 10-15 bps of outperformance in our global portfolios.
Some peripheral European government bonds offer higher yields
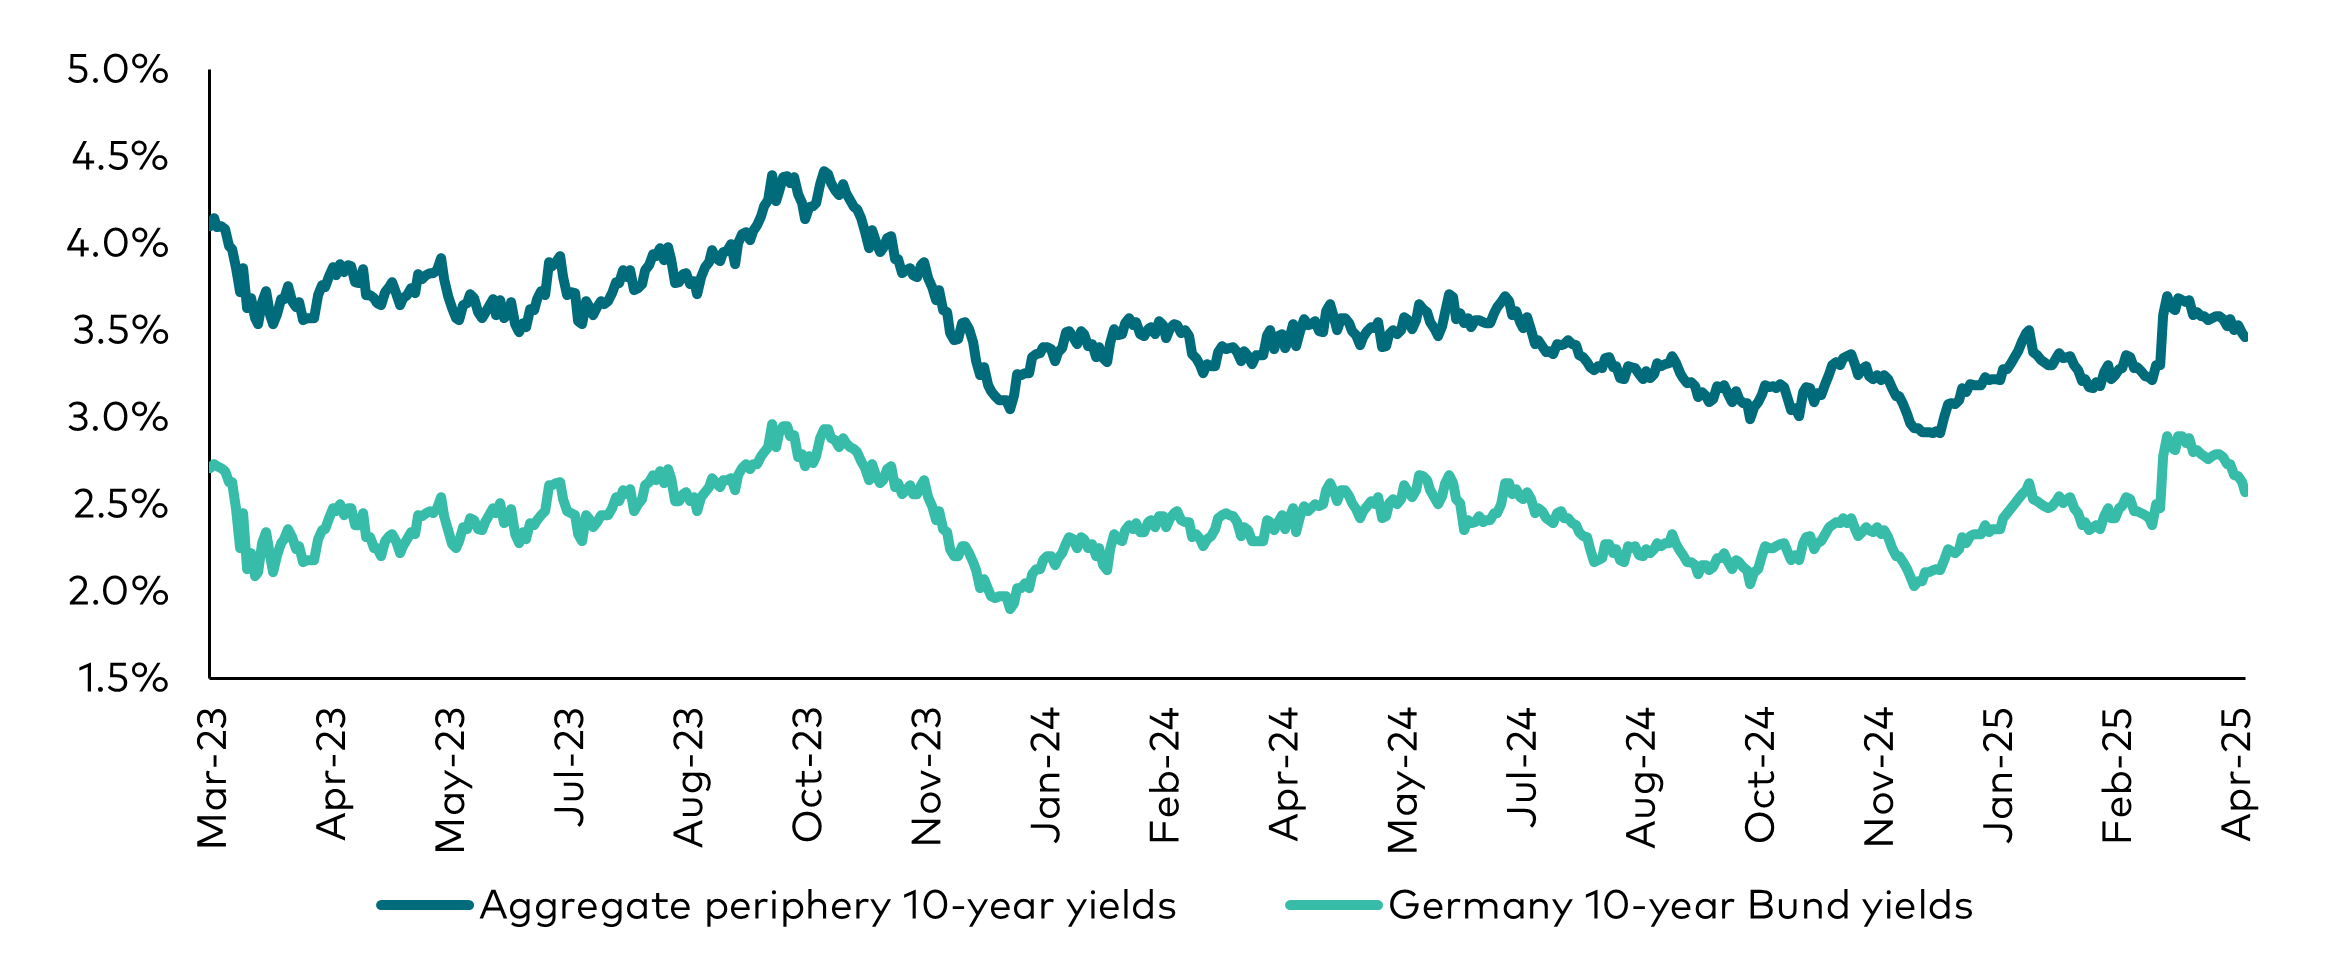
Note: The chart shows the GDP-weighted aggregate yield of 10-year sovereign bonds of Portugal, Ireland, Italy, Greece and Spain compared with the 10-year German bund yield.
Source: Macrobond. Data period 1 March 2023 to 4 April 2025.
The yield differential between Europe’s periphery countries and Germany is narrowing
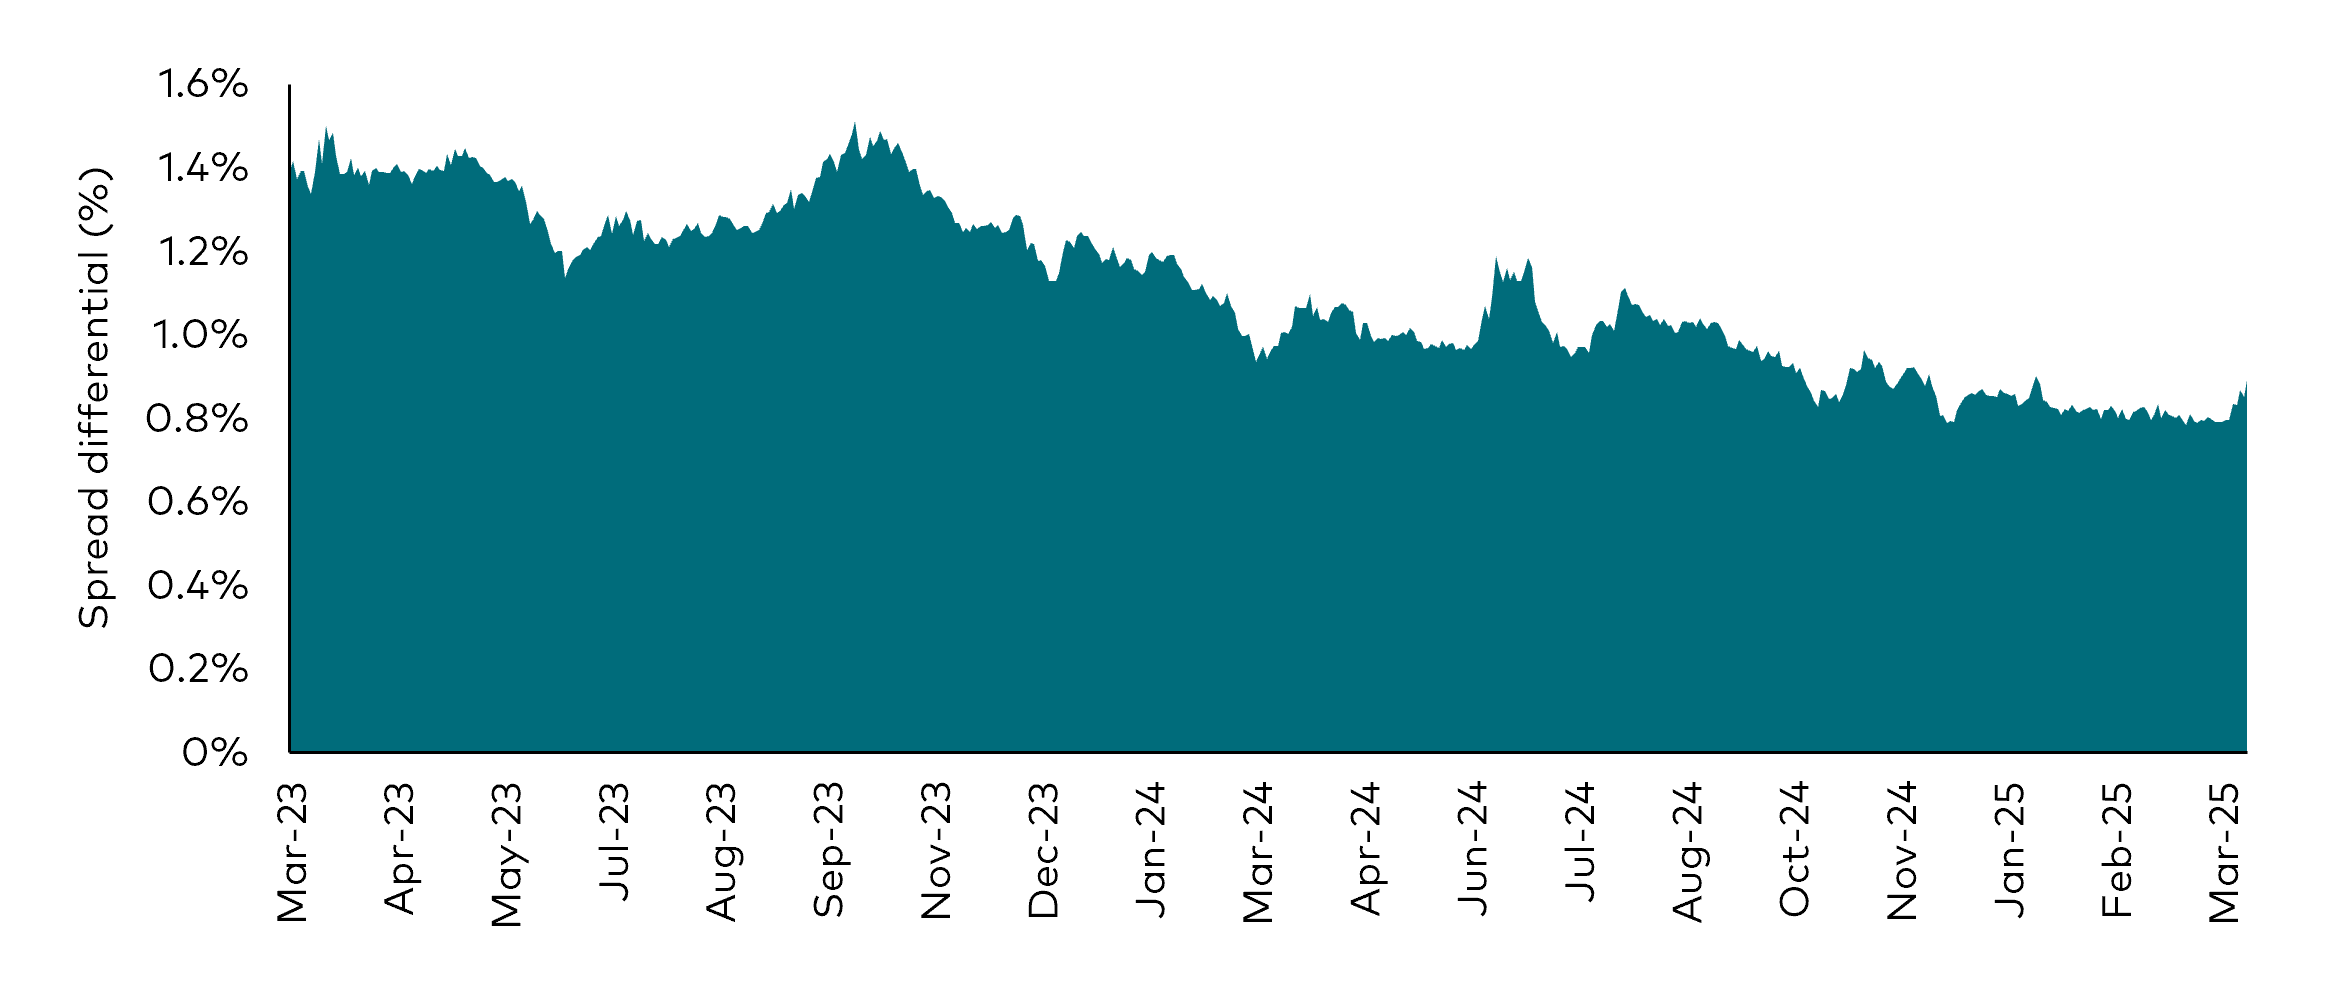
Note: The chart shows the GDP-weighted aggregate yield of 10-year sovereign bonds of Portugal, Ireland, Italy, Greece and Spain, net of the 10-year German bund yield.
Source: Macrobond, for the period 1 March 2023 to 4 April 2025.
UK
The UK's risk premium has shifted, bringing UK gilt yields more in line with US Treasuries than German bunds. This is mostly due to the ongoing effects of Brexit and high inflation.
The UK bond market now more resembles that of Australia than other European countries, where short-term rates align with the policy of the country’s central bank – in this case, the Bank of England – but long-term rates track those in the US. This presents a value opportunity, particularly in the 30-year part of the yield curve, where gilt yields offer a 30-50 bps premium over 30-year US Treasuries.
Japan
Japan is undergoing significant changes. The market has under-appreciated Japan’s shift towards more orthodox economic principles, leading to higher wage growth and rising inflation. Increasing services and inflation rates will mean the Bank of Japan (BoJ), will need to continue raising rates, creating a dynamic and potentially lucrative investment environment.
- Investment Strategy: We are significantly underweight Japanese government bonds (JGBs) and are actively shorting them through options and interest rate swap strategies. We believe the Japanese economy will continue to grow and produce robust rates of inflation, allowing shorter-end JGB yields to shift towards 1.5%.
Japan: Land of the rising yields
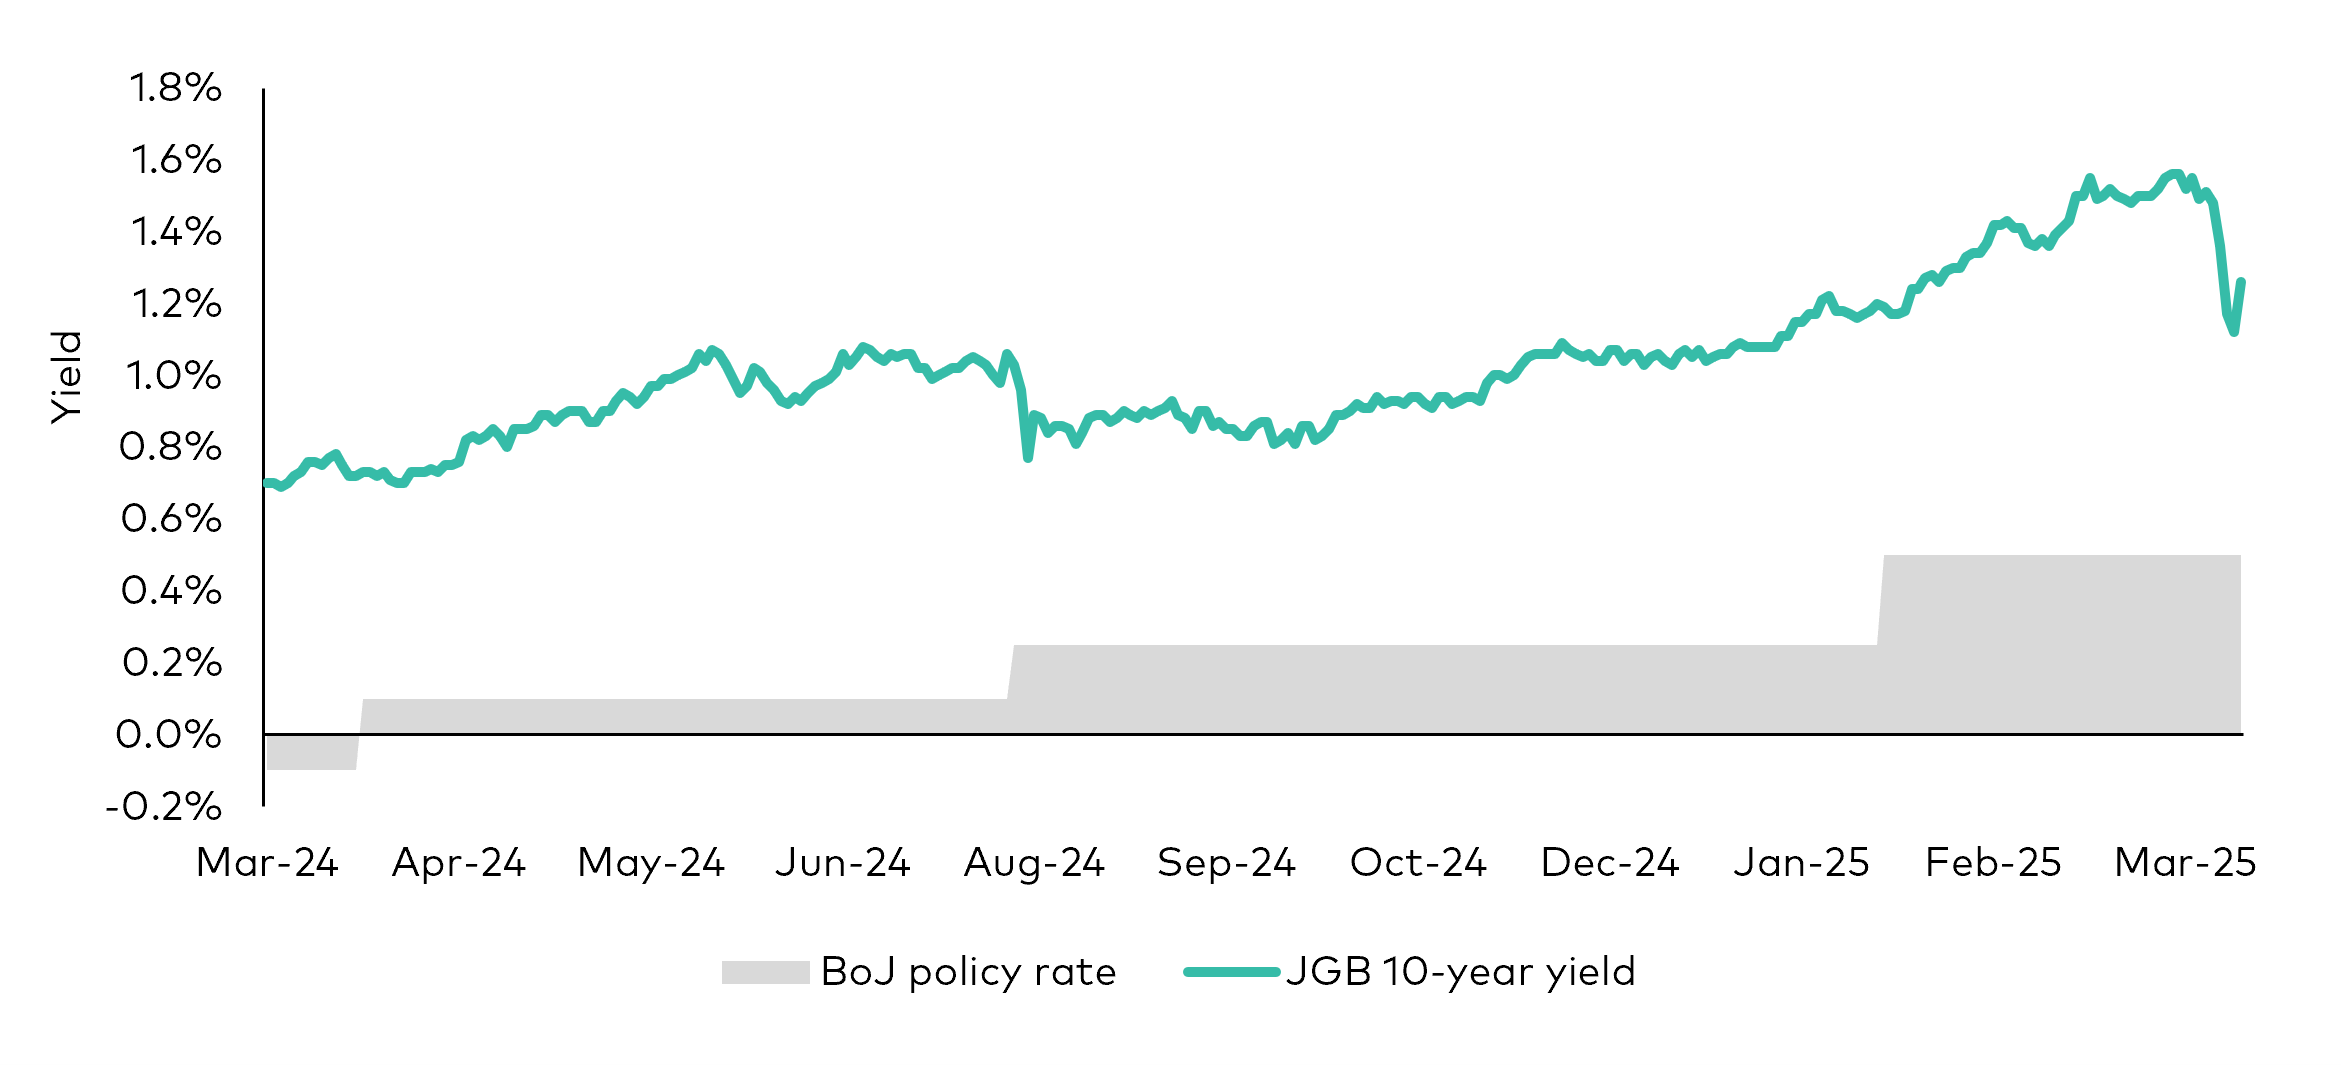
Source: Vanguard and Macrobond, for the period 1 March 2024 to 9 April 2025.
Credit
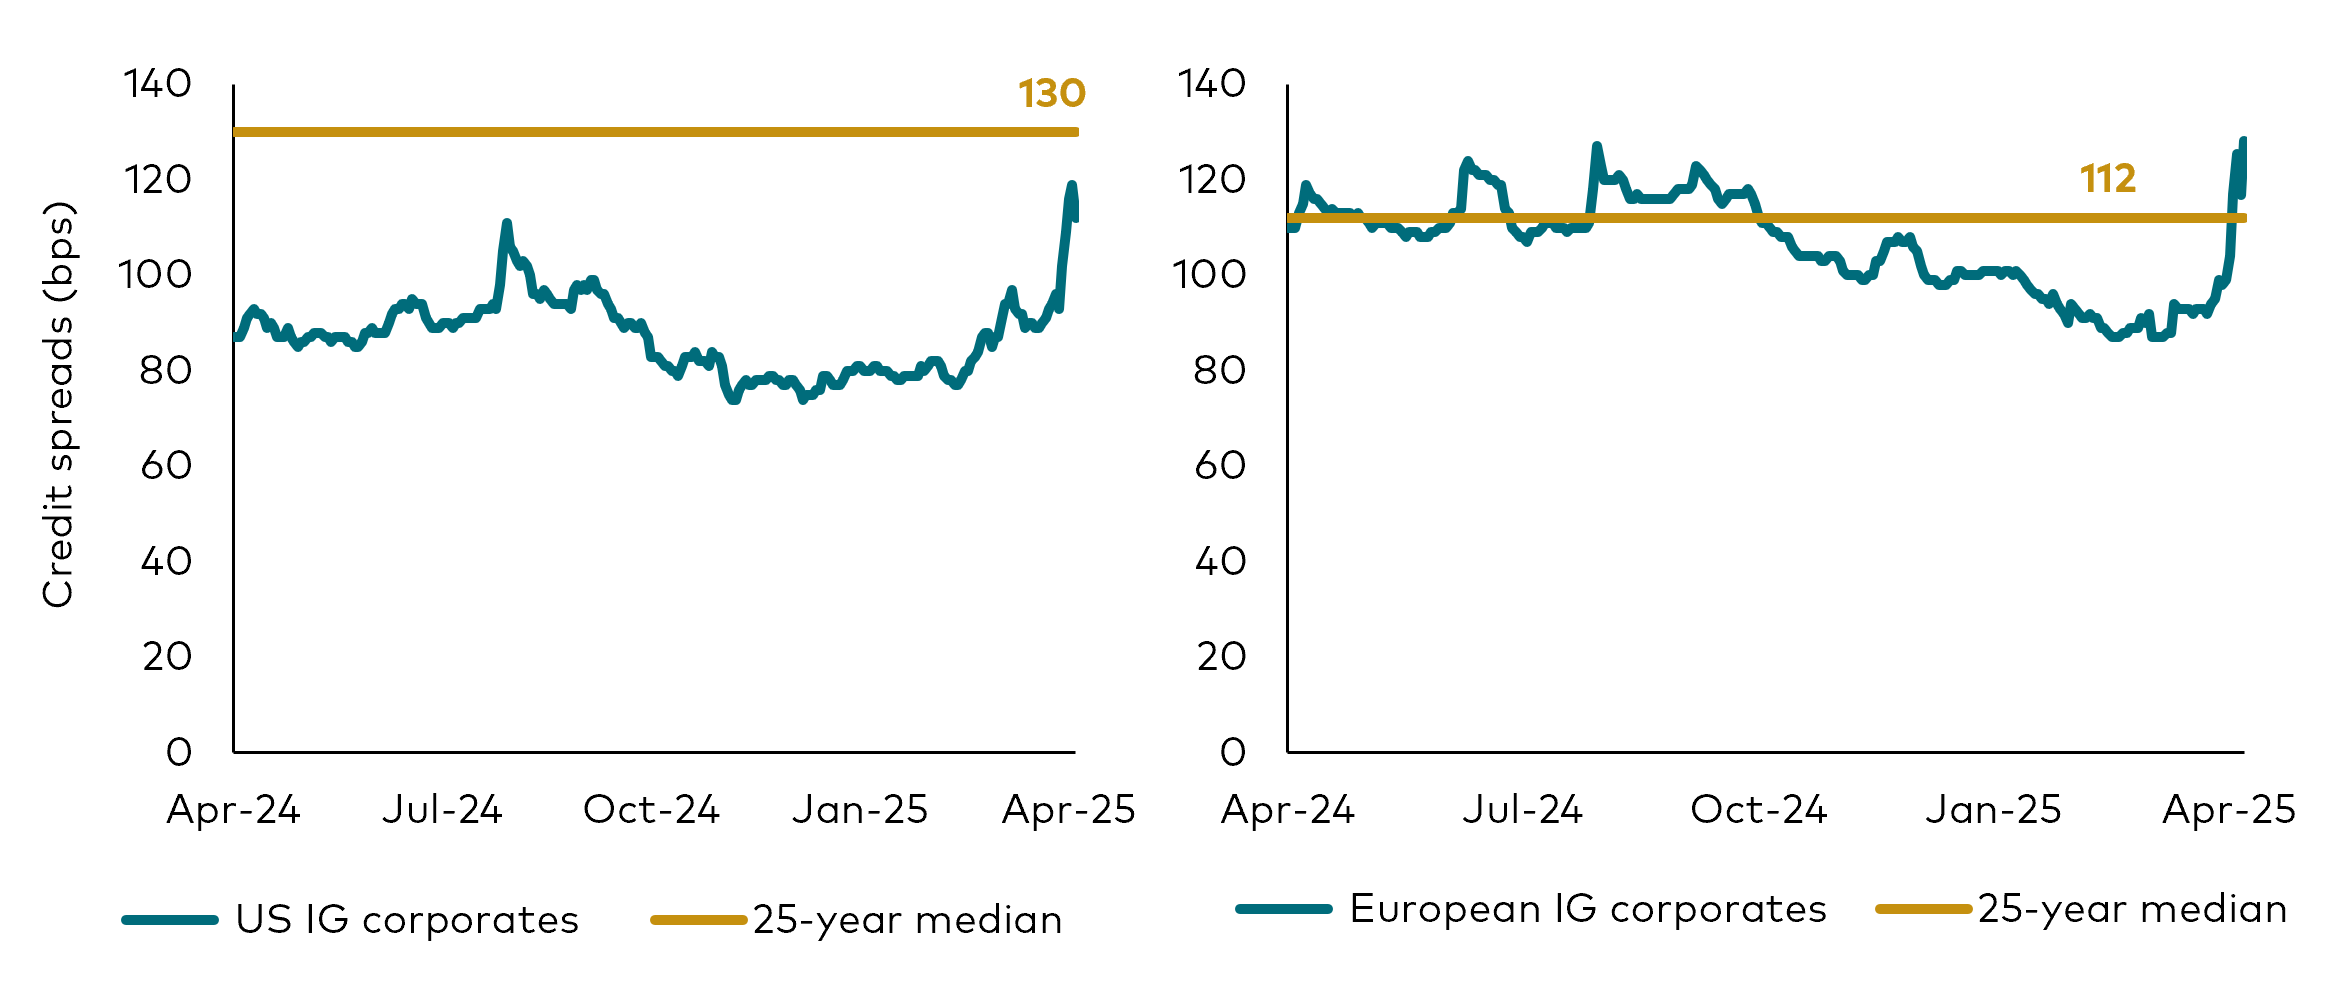
Credit spreads globally moved gradually wider in the final weeks of the first quarter, before spiking in the days following the 2 April tariff announcements, as markets priced in a justifiably higher risk premium across sectors.
We reduced our credit exposure in early March ahead of the larger move in spreads. We remain cautious but opportunistic. Although valuations are now more attractive compared with the start of the year, they haven't reached levels that justify broad-based buying. In the near term, it's unlikely that spreads will return to the narrow levels seen at the start of the year. If recession risks increase, we expect spreads to widen significantly.
We remain defensively-positioned in segments of credit that have greater earnings stability and less exposure to tariff risks. For now, we are more selective in lower-quality sectors, focusing on individual issuers, given the higher vulnerability to weaker growth.
Despite shifts in sentiment, however, strong corporate and consumer-backed credit fundamentals, along with robust investor demand, persist.
Perspective on US corporate fundamentals
Since the Covid-19 pandemic, we have consistently emphasised the strong position of US corporate balance sheets. The downstream effects of tariff policies will be felt unevenly across sectors and will vary for each company. Our direct engagement with management teams and our extensive credit research coverage enables us to assess each corporate issuer’s situation individually, allowing us to determine fair value price levels for their debt.
In the months ahead, we expect companies to pull or lower their earnings guidance, which until recently, had been at optimistic levels for 2025. We’ll continue to assess the degree to which companies are able to pass on higher costs to consumers and to what degree these price changes will impact consumer demand. We see the best opportunities today in pharmaceuticals, utilities and banks, which are well capitalised and can continue to benefit from deregulation.
Reassessing the relative value of European credit versus US credit
Over the past year, we have favoured European investment-grade (IG) corporates over their US counterparts. Despite the stronger fundamentals of US corporates due to a divergence in growth between the two markets (US exceptionalism versus a slowdown in European growth), US IG credit spreads tightened to expensive levels, dipping as low as 80 bps – their tightest margin since June 2021. This helped to make European IG corporates more attractive from a relative valuation perspective.
The strong risk-off reaction to US tariff developments has led to a sharp widening in US credit spreads, driven by lower growth and higher inflation expectations. Meanwhile, European IG credit spreads have also widened recently due to tariff concerns, but they are also benefitting from the optimism around Germany’s fiscal stimulus plans. This, combined with the improving prospect of an end to the conflict in Ukraine, could provide strong growth tailwinds in the region.
As a result, the spread differential between US and European IG corporates narrowed - before eventually closing entirely - by the end of March, prompting us to reduce our structural preference for European IG corporates going forward. We continue to assess relative-value opportunities on a sector-by-sector basis, focusing more than ever on idiosyncratic and bottom-up security selection.
The differential between European IG and US IG credit spreads has narrowed
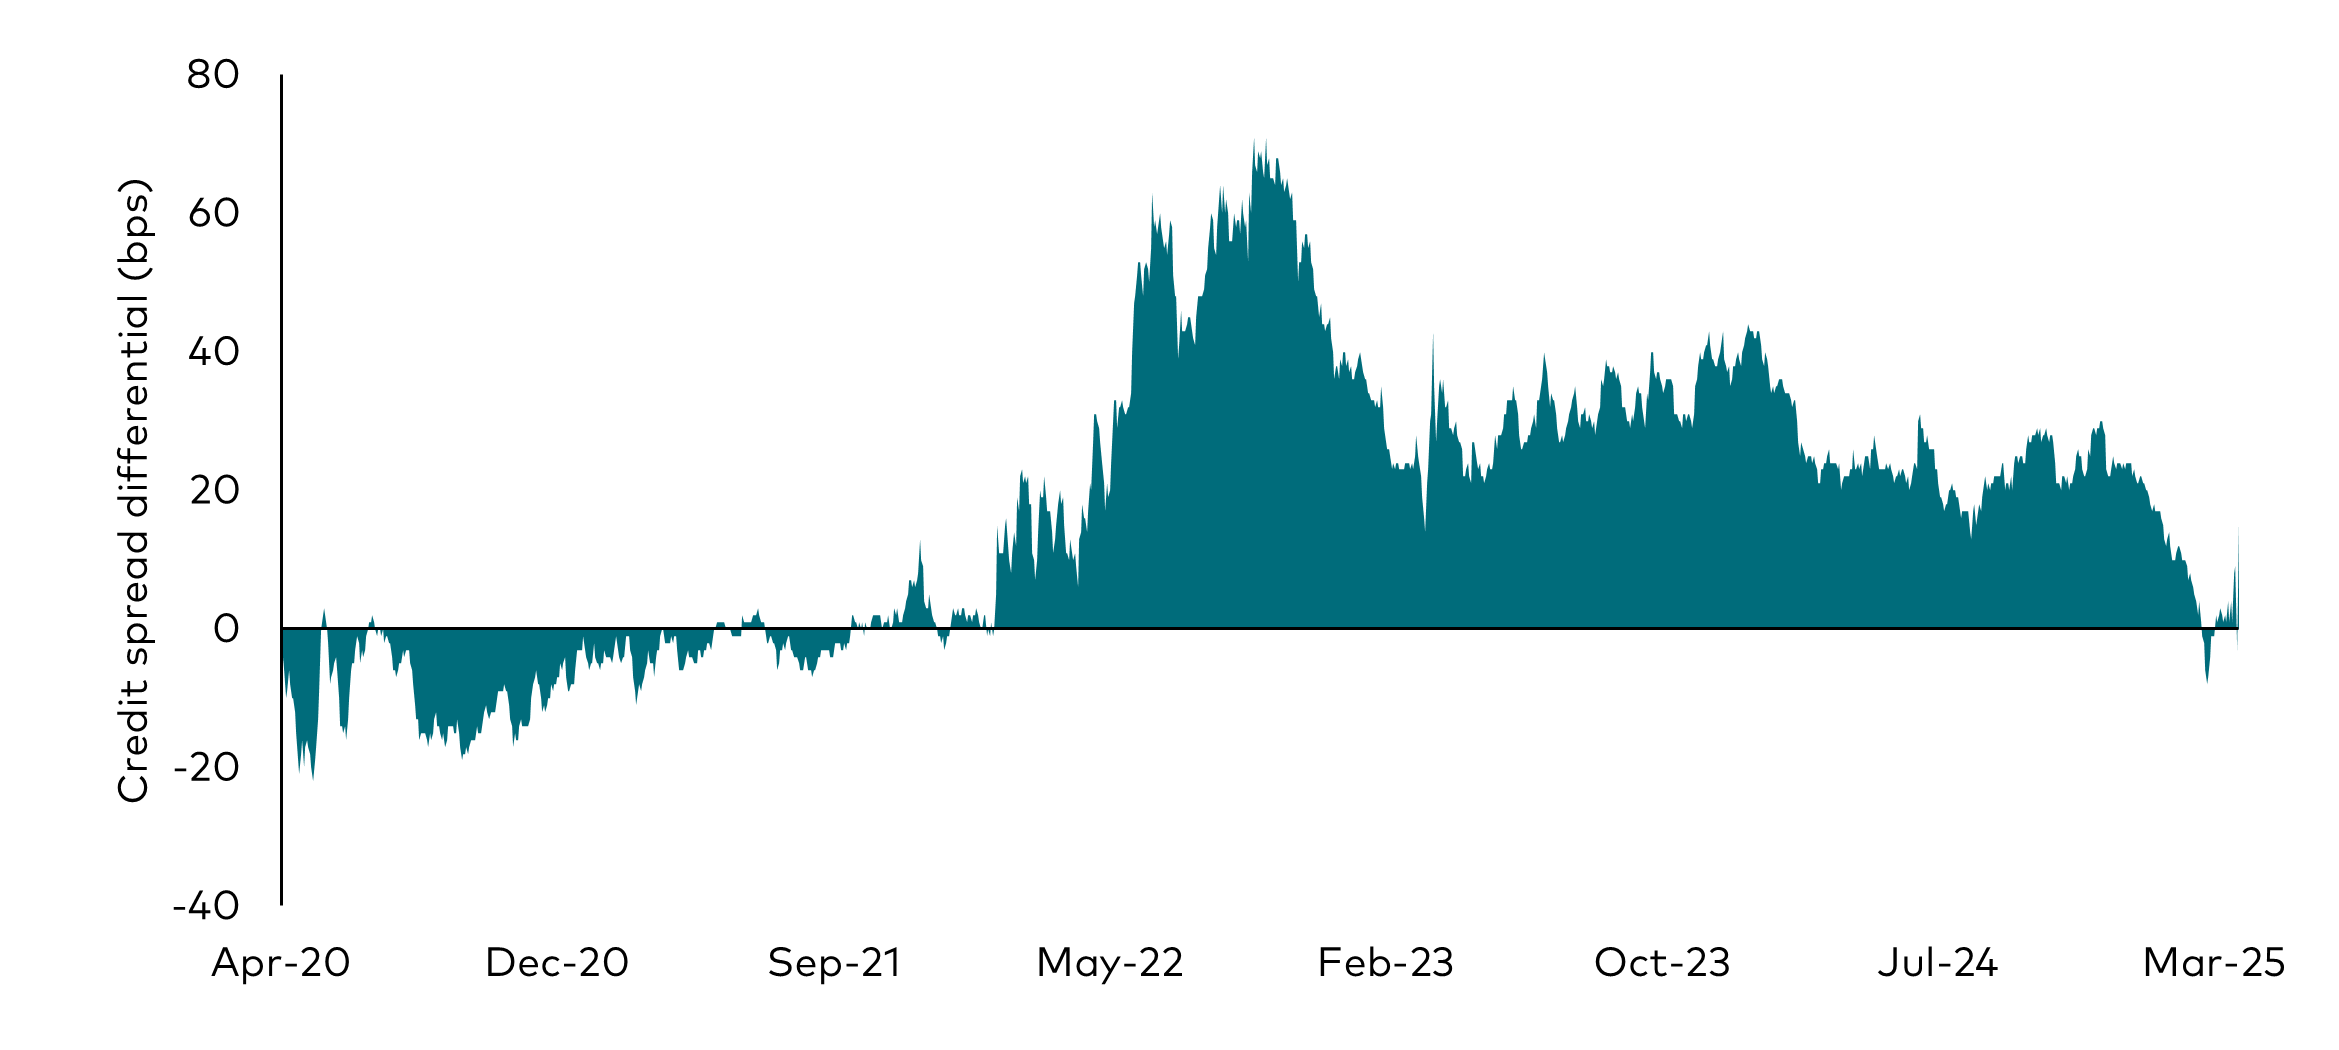
Note: Chart shows the option-adjusted spread (OAS) differential between European IG corporate spreads less US IG corporate spreads. Proxies used: European IG corporates: Euro Aggregate Corporate Average OAS Index; US IG corporates: Bloomberg US Agg Corporate Average OAS Index.
Source: Bloomberg. Data is for the period 9 April 2020 to 9 April 2025.
Credit spreads widened suddenly in late March and early April
US IG corporates European IG corporates
US high yield European high yield
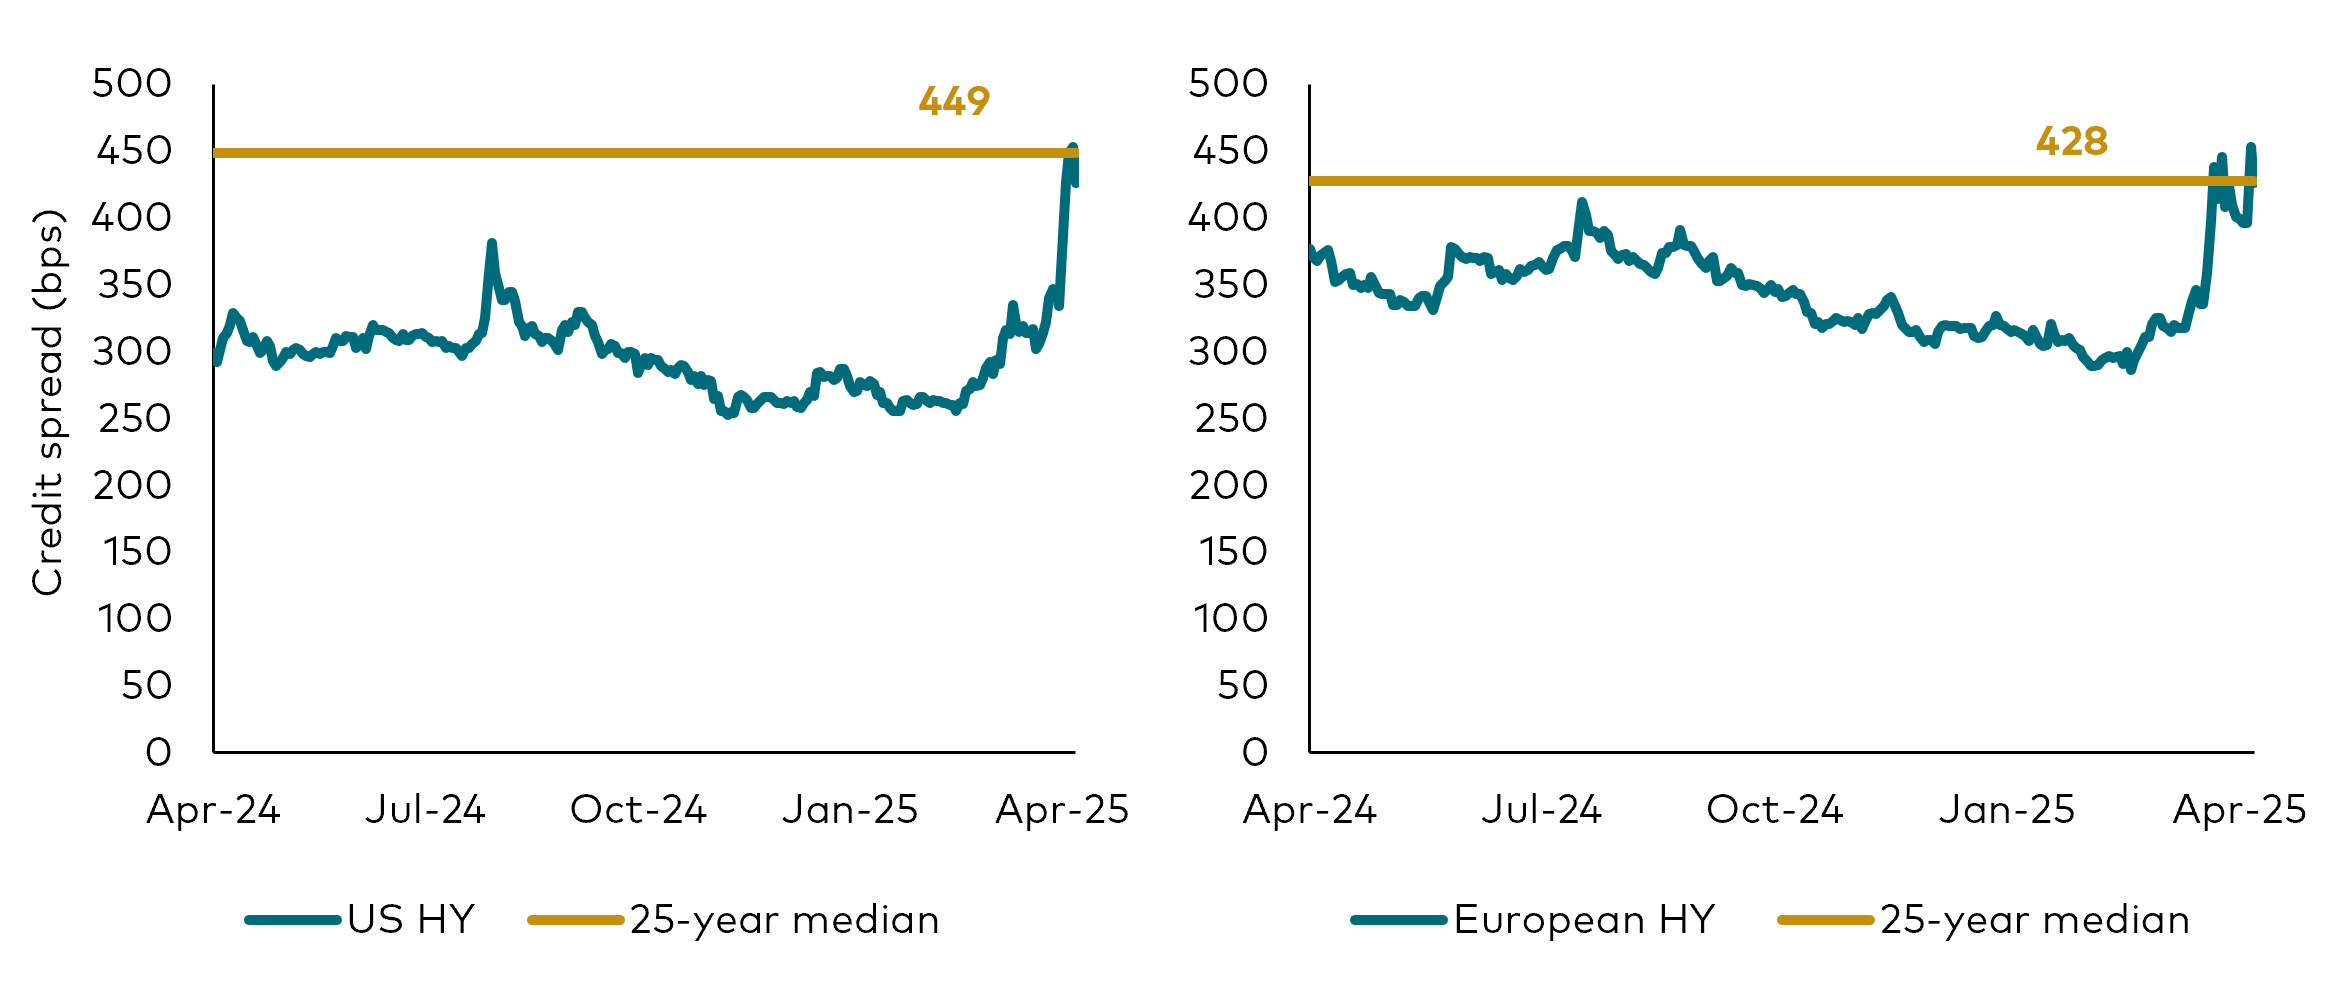
Source: Bloomberg, as at 9 April 2025. Indices used: Bloomberg US Agg Corporate Average OAS; Bloomberg Pan European Aggregate Corporate Average OAS; Bloomberg US Corporate High Yield Average OAS; Bloomberg Pan-European High Yield Average OAS.
Emerging markets
Emerging market (EM) credit returned 2.2% in the first quarter, in line with other fixed income asset classes. Deteriorating risk appetite due to intensifying policy uncertainty drove EM credit spreads 24 bps wider. However, the increasing probability of a global economic slowdown led to strong returns in the US Treasury component of EM credit returns (+3.2%), more than offsetting the move wider in spreads.
EM sovereign bonds offer a compelling mix of attractive yields and longer durations, providing better downside protection relative to EM corporates and US HY. We think the asset class is under-owned by investors and offers a wide range of relative-value opportunities, particularly when market volatility is high in other areas of fixed income.
The case for EM sovereigns over EM corporates
Since 2022, EM corporates have outperformed their sovereign counterparts, supported by a combination of larger spread compression and a shorter duration profile. This has led to the unusual situation where EM sovereigns currently yield more than EM corporates, which face additional pressures from potential tariffs. In addition, EM sovereigns offer better liquidity, a lower likelihood of credit surprises and better prospects in the event of default.
EM sovereigns offer higher spreads and longer durations than EM corporates
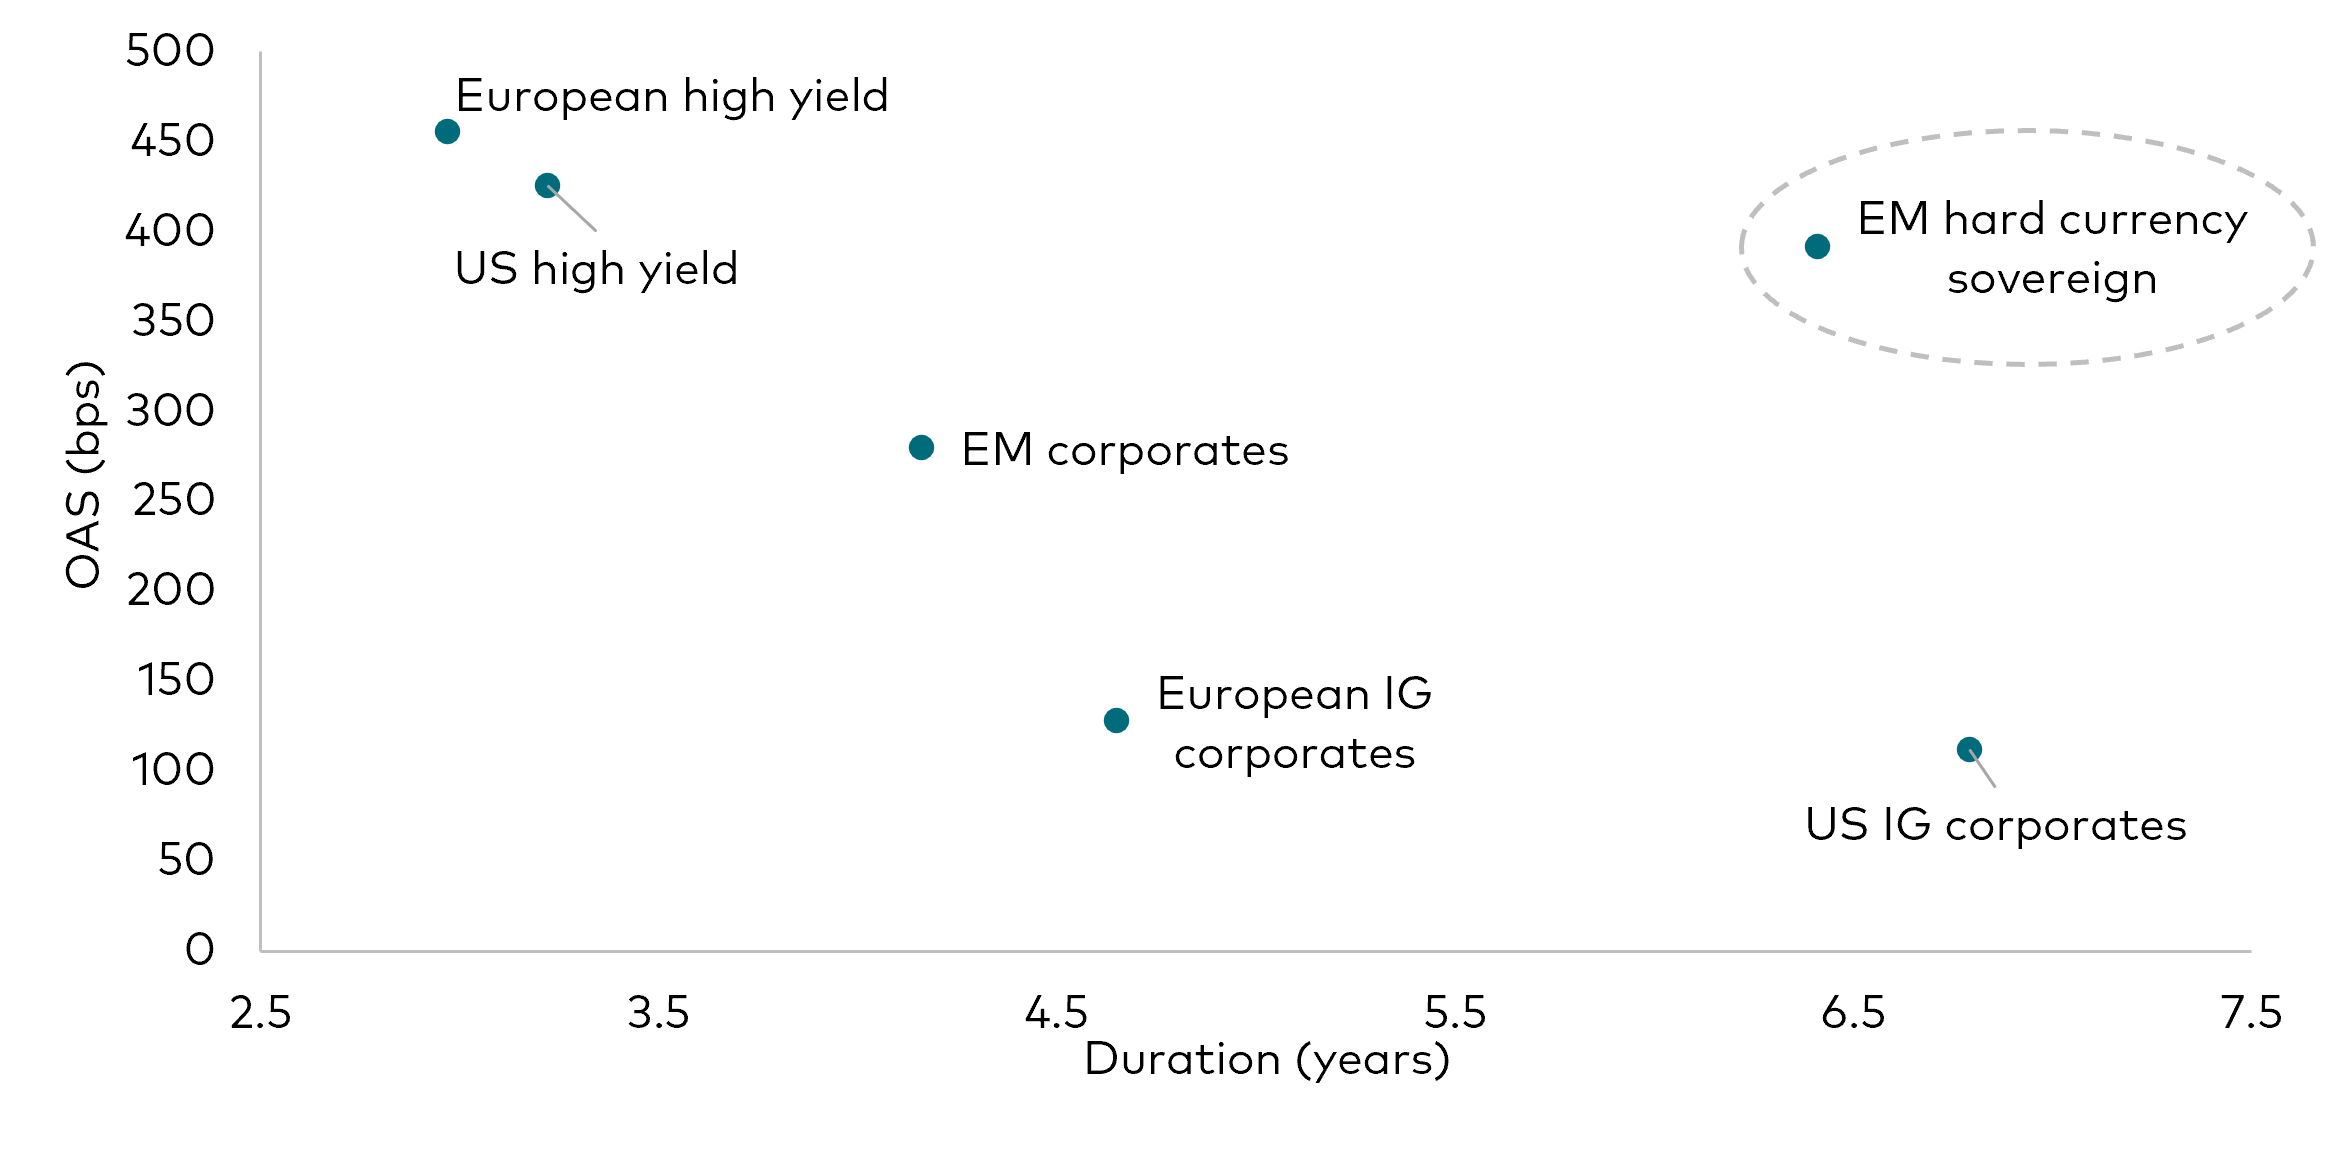
Source: Bloomberg, as at 9 April 2025. Indices used: US high yield: ICE BAML US High Yield Index ICE of BAML, European high yield: ICE BAML European High Yield Index, European IG: Bloomberg Euro Aggregate Corporates Index, US IG: Bloomberg US Corporates USD Index, EM hard currency sovereigns: J.P. Morgan EMBI Global Diversified. EM corporates: J.P. Morgan CEMBI Global Diversified Index.
Spread differential between EM corporates and EM sovereigns (bps)
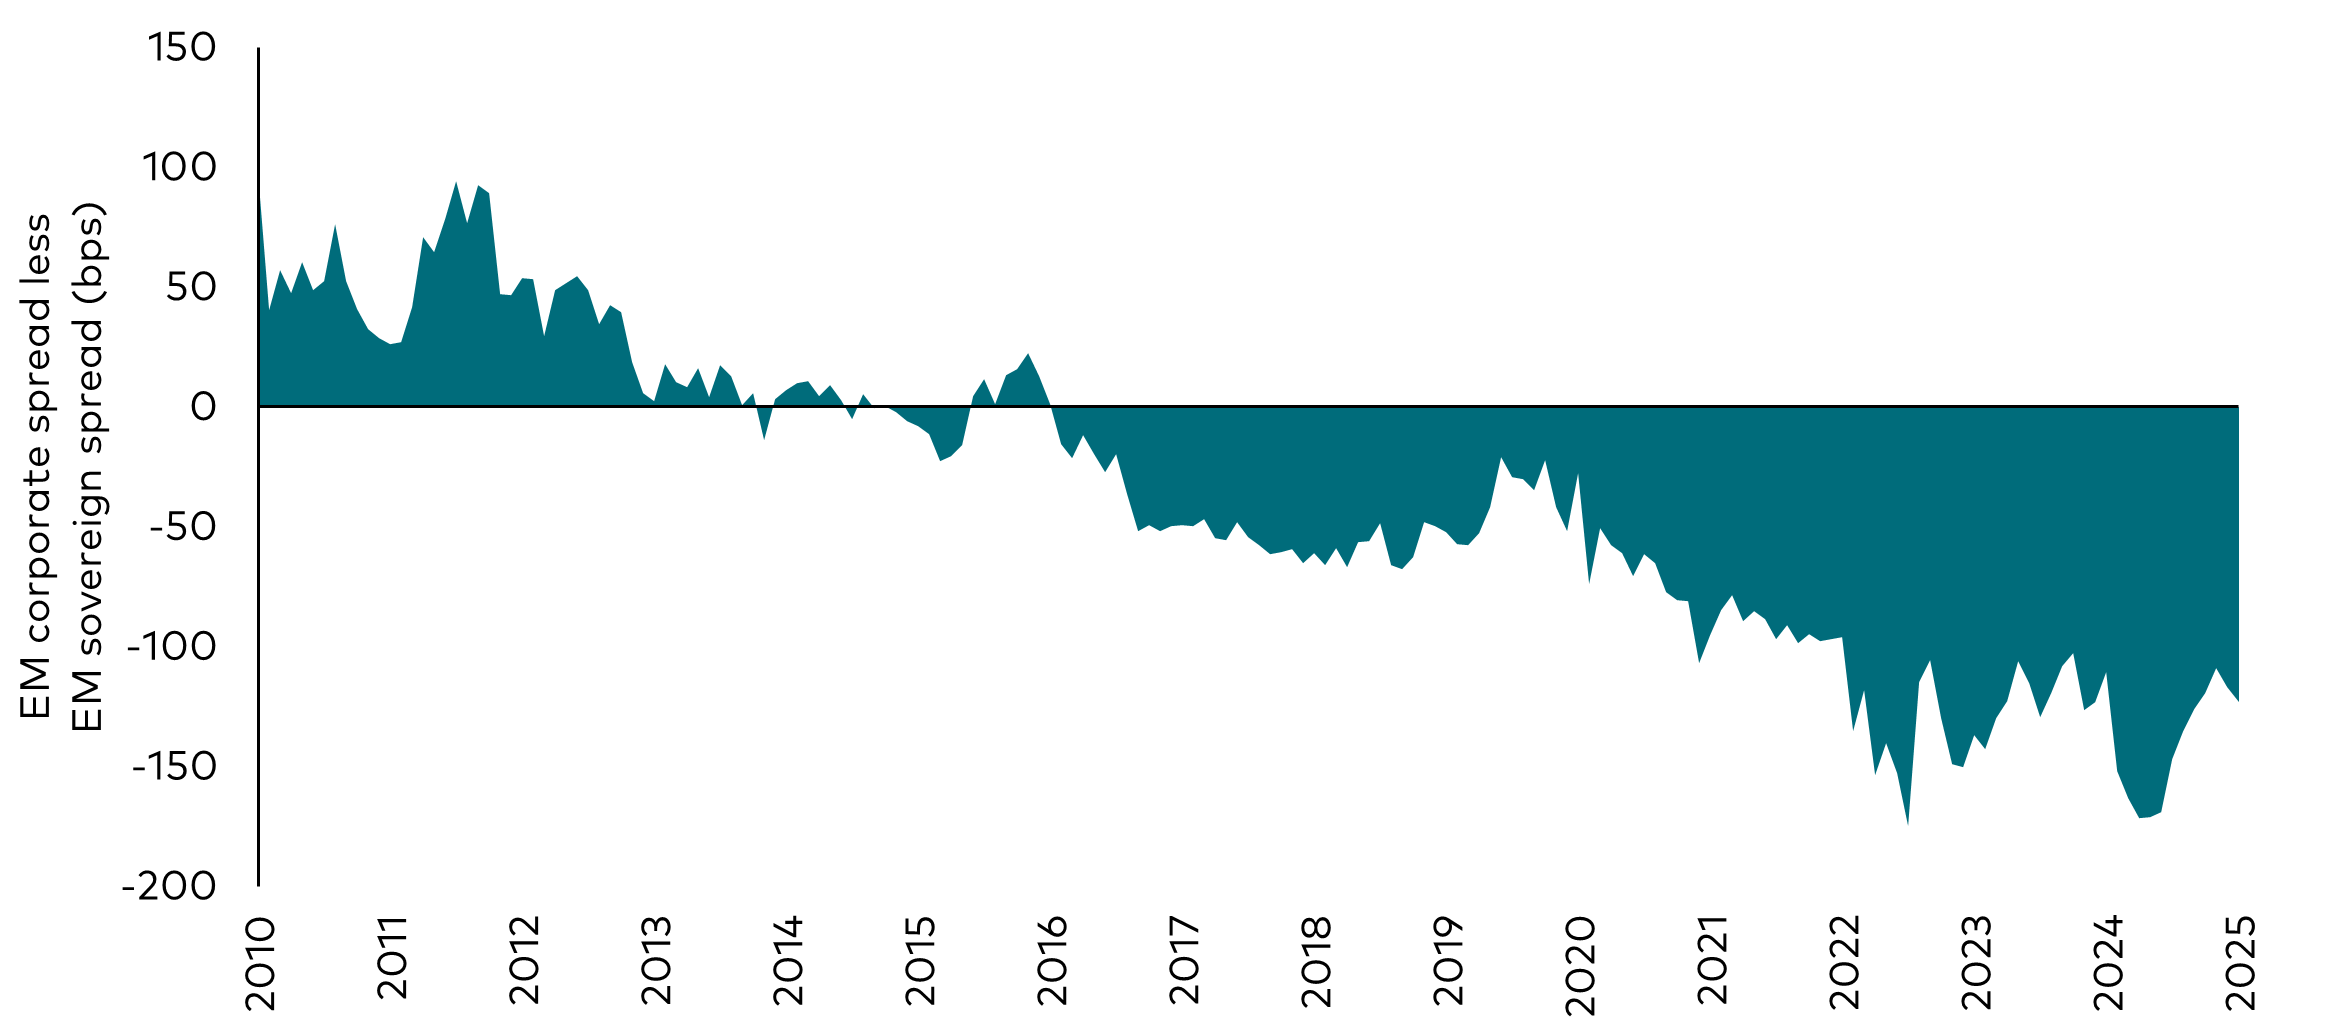
Source: Bloomberg, for the period from 31 March 2010 to 31 March 2025. Proxies used: EM sovereigns: J.P. Morgan EMBI Global Diversified; EM corporates: J.P. Morgan CEMBI Global Diversified.
EM corporates outperformed US IG and US HY in the first quarter. While all-in yields still look attractive heading into the second quarter, they leave a limited cushion to act as a buffer against any macroeconomic and fundamental shocks. There has been a de-risking by many dedicated and crossover EM investors, reflected in high cash levels and demand for credit protection. But we’re still seeing some crowded trades2, as evidenced by the recent unwind in Turkey local duration positions. This reinforces the importance of sizing trades correctly, especially those with tail risks and where positions are crowded.
In the wake of the tariff announcements, EM markets are now trading on a higher risk of a slowdown in the US economy and increasing inflationary pressures due to higher prices, which could lead the Fed to maintain higher rates. This stagflationary scenario could be a headwind for EM fixed income and merits close monitoring in the weeks and months ahead.
We continue to monitor the credit situations in Romania and Panama, which are both at risk of losing their IG rating status and could lead to large-scale forced selling in markets. We think there is still scope for both countries to avoid ratings downgrades, even though their credit spreads have arguably already priced in a good degree of downgrade risk - but getting this call correct will be important. Meanwhile, given the announcements on 9 April, Mexico appears to have been relatively spared on the tariff front, and we think this is constructive for most Mexican assets.
EM local currency debt was a standout performer (+4.4%) in the first quarter, outperforming hard currency bonds. EM rates kept up with the rally in US Treasuries and EM currencies appreciated against the US dollar, which remains historically expensive in real terms. Going forward, we anticipate rates in Asia and Europe to benefit most from any slowdown in global trade, especially if the US dollar struggles to appreciate strongly owing to its stretched valuation.
Strategy map
Rates
| Exposure | View | Strategy |
|---|---|---|
US duration & yield curve |
US economic sentiment measures have turned lower. The realisation of softer US economic outcomes, along with vulnerabilities in risk assets, can see yields trend lower. |
We remain strategically long US duration as a hedge to our credit exposure amid slowing growth and policy uncertainty. |
Global duration and yield curve |
Changes in Germany’s future fiscal stance are likely to drive relative euro area fixed income underperformance. Peripheral European economies should reflect improving fundamentals and increased cohesion in the region. BoJ policy normalisation puts pressure on the JGB yield curve to move higher and flatter. |
We retain a modest overweight in peripheral Europe. We are short Germany versus UK rates. We remain short JGBs and positioned for yield curve flattening. |
Credit
| Exposure | View | Strategy |
|---|---|---|
Investment- grade corporates |
Recent earnings continue to show strength, but expectations are for lower revisions and more cautious guidance. Spreads have widened to more attractive levels but still do not reflect larger growth risks. |
We favour companies that are more resilient to weaker growth and tariff impacts. We are overweight pharmaceuticals, utilities and banks. We are no longer biased towards European IG given the closing of the spread differential with US IG. |
High-yield corporates |
HY spreads have widened but remain below long-term averages when accounting for the sector’s higher quality and shorter maturity profile. Credit fundamentals are strong and default rates remain very low. |
We hold a lower-than-average allocation to HY credit. Focus is on bottom-up security selection as dispersion across issuers remains high. |
Emerging markets |
Our outlook for EM credit fundamentals is mostly stable across countries. All-in yields are attractive, but spread levels are tight and leave little cushion for macroeconomic or fundamental shocks. EM corporates look less attractive relative to EM sovereigns, which currently offer higher all-in yields and longer durations than EM corporates. |
We have raised the quality bias of our EM portfolio. We are long select EM local rates where we see more scope for central banks to ease policy. We have reduced our exposure to EM corporates. |
1 As measured by the Personal Consumption Expenditures index.
2 Crowded trades are popular short-term positions in certain bonds and currencies that can be dangerous in an environment of heightened volatility as they are more vulnerable to sudden sell-offs and can exacerbate market moves.
Our active bond funds managed in-house
Webinar live e on-demand
Esplora di più i nostri prossimi eventi e webinar on-demand.
Investment risk information
The value of investments, and the income from them, may fall or rise and investors may get back less than they invested.
Past performance is not a reliable indicator of future results.
Some funds invest in emerging markets which can be more volatile than more established markets. As a result the value of your investment may rise or fall.
Funds investing in fixed interest securities carry the risk of default on repayment and erosion of the capital value of your investment and the level of income may fluctuate. Movements in interest rates are likely to affect the capital value of fixed interest securities. Corporate bonds may provide higher yields but as such may carry greater credit risk increasing the risk of default on repayment and erosion of the capital value of your investment. The level of income may fluctuate and movements in interest rates are likely to affect the capital value of bonds.
Any projections should be regarded as hypothetical in nature and do not reflect or guarantee future results.
Reference in this document to specific securities should not be construed as a recommendation to buy or sell these securities, but is included for the purposes of illustration only.
Important information
For professional investors only (as defined under the MiFID II Directive) investing for their own account (including management companies (fund of funds) and professional clients investing on behalf of their discretionary clients). In Switzerland for professional investors only. Not to be distributed to the public.
The information contained in this document is not to be regarded as an offer to buy or sell or the solicitation of any offer to buy or sell securities in any jurisdiction where such an offer or solicitation is against the law, or to anyone to whom it is unlawful to make such an offer or solicitation, or if the person making the offer or solicitation is not qualified to do so. The information in this document does not constitute legal, tax, or investment advice. You must not, therefore, rely on the content of this document when making any investment decisions.
The information contained in this document is for educational purposes only and is not a recommendation or solicitation to buy or sell investments.
Issued in EEA by Vanguard Group (Ireland) Limited which is regulated in Ireland by the Central Bank of Ireland.
Issued in Switzerland by Vanguard Investments Switzerland GmbH.
Issued by Vanguard Asset Management, Limited which is authorised and regulated in the UK by the Financial Conduct Authority.
© 2025 Vanguard Group (Ireland) Limited. All rights reserved.
© 2025 Vanguard Investments Switzerland GmbH. All rights reserved.
© 2025 Vanguard Asset Management, Limited. All rights reserved.
4182810
